09 Apr Weekly Trade Opportunities and Forecast Models Report
This week we cover the following in our Weekly Forecast and Trade Ideas Report
- 17 Swing Trade Ideas
- Leading sectors
- Swing Trading out of Base Patterns- Tips and More
- Track Record keys, how to stay profitable consistently
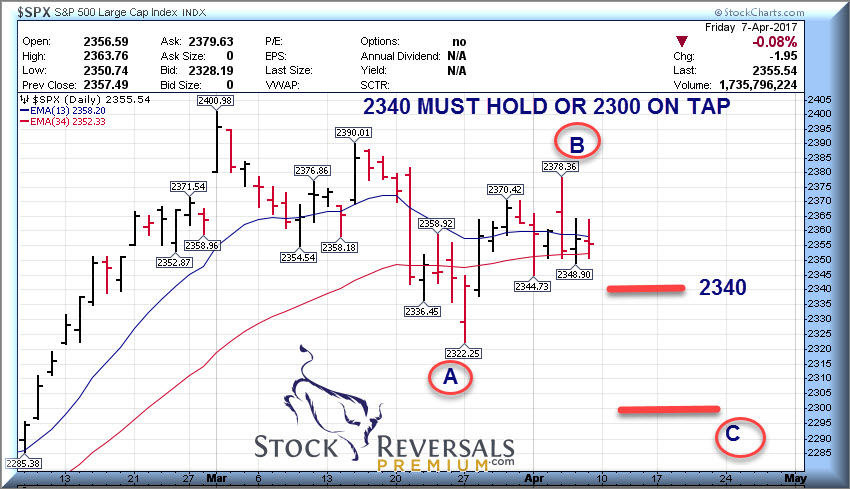
- SP 500 not yet out of woods? 2340 key tell
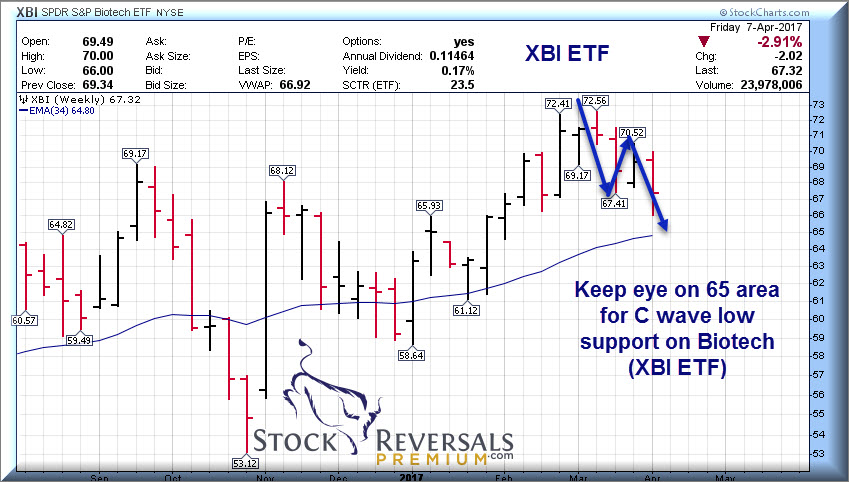
- Biotech in C wave of ABC correction, what to watch
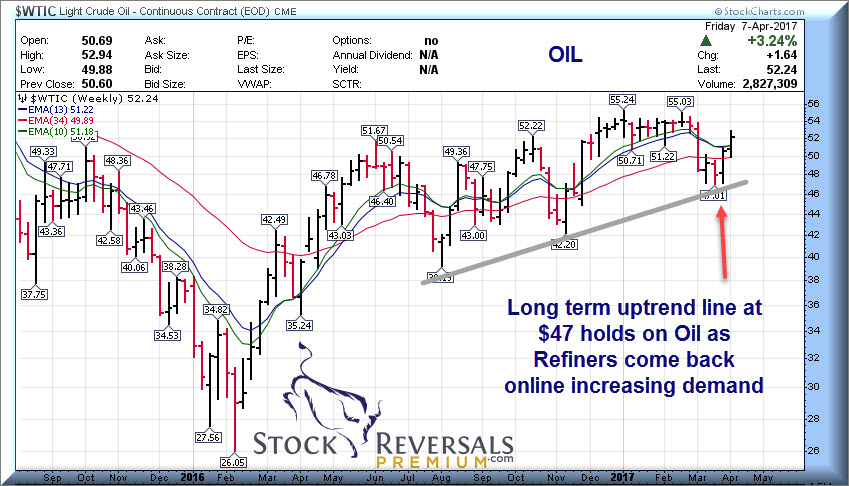
- OIL holds the $47 line in sand with triple bottom
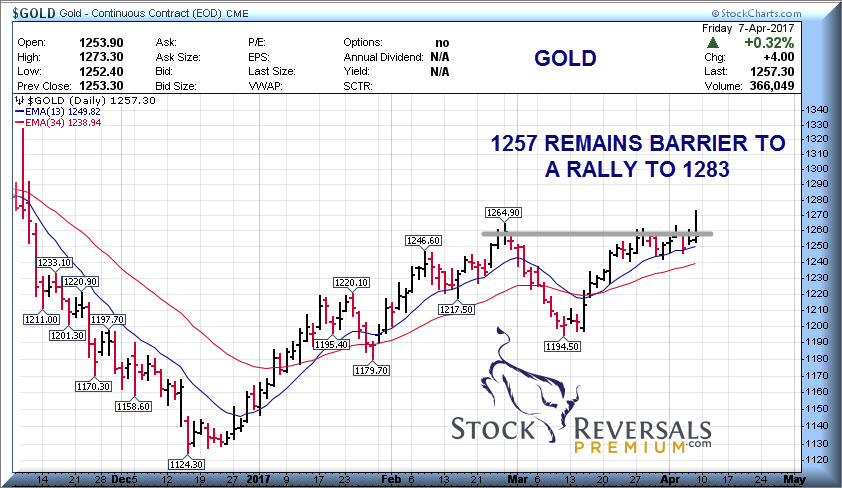
- Gold update, 1257 key
BIG PICTURE SP 500- More forecasts at bottom of report following stock and trading ideas
Take a moment to Opt In for our Free Stock research and Market Forecasts here: Name and E-mail only, and we do not share your information with any other entity.

Market Notes: Sectors and Sentiment Measures
Leading sectors of late – Chips, Computers, Electronics, Leisure, Banks, and Media
Sentiment surveys- Advisors are at 55.8% Bullish up from 47% recently and 18% are Bearish, all indicators of Major Wave 3 up of Primary Wave 5
Swing Trading out of Bases- First the fundamentals, then the pattern:
At SRP we are Swing Trading on a regular basis with entries and exits defined. However, the alerts do not go out until several steps have taken place.
There are several keys to our long term success with our Track Record of near 80% winners. The basics are reviewing the fundamentals, share structure, product lines, management, competition, valuations, balance sheets and catalysts. However, we also like to couple the fundamental analysis with chart patterns that line up at the same time. Essentially the long lost art of Fundamental Analysis coupled with Technical Analysis is what makes our hit rate so high. Most traders do not have the required patience to wait for the right set up to come to them, but we find very few swing traders do any fundamental analysis at all, and this gets them into trouble eventually.
We believe many traders spend a lot of time chasing charts if you will. That is all well and good and you can certainly make money off chart patterns, as we do. However, your “miss” percentages will rise dramatically when the fundamentals have not been reviewed on a relative basis in our opinion. One way to raise your HIT RATIO is to make sure the fundamentals are matching up with that exciting chart pattern.
That requires time and effort, which is why we launched the SRP subscription service to begin with. We put in the time and effort to do that FA work, and then we apply the TA… saving you time, and effort.
Lets assume we already like the fundamentals and now we are focusing on one of the chart patterns we like. That is the Base Pattern. We prefer 3 weeks minimum for a base, and 5-8 weeks is even better depending. You can avoid a lot of dead money time by trying to enter into bases just before they breakout, as opposed to entering them just as they are starting a base.
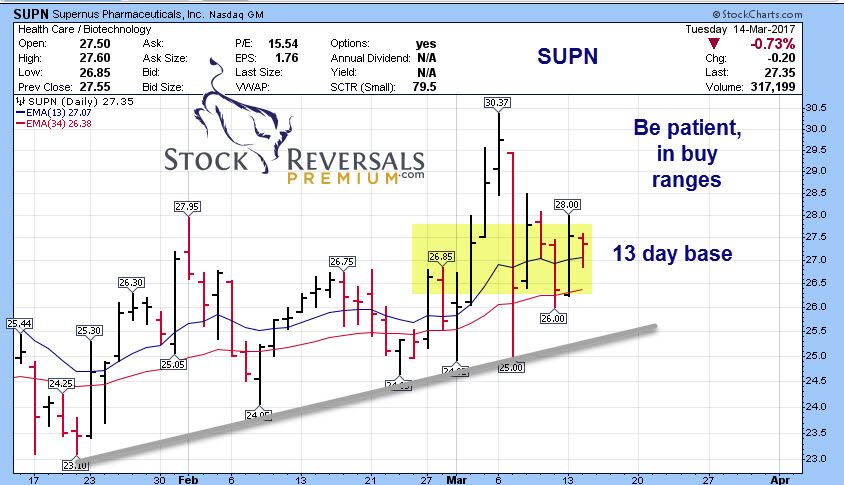
A recent sample would be SUPN. This is a 13 day base pattern, one of the smaller bases we look at on a daily chart. We can see the stock had been volatile overall, but if we strip out the spikes and noise (Had to do with some news that was incorrectly interpreted in our opinion, that would be that fundamental analysis stuff)…. we can see a 13 day base.
13 days is a human behavioral pattern, so is 5, 8, and 21 and 34… noting those are all Fibonacci numbers. Our notes were to be patient…
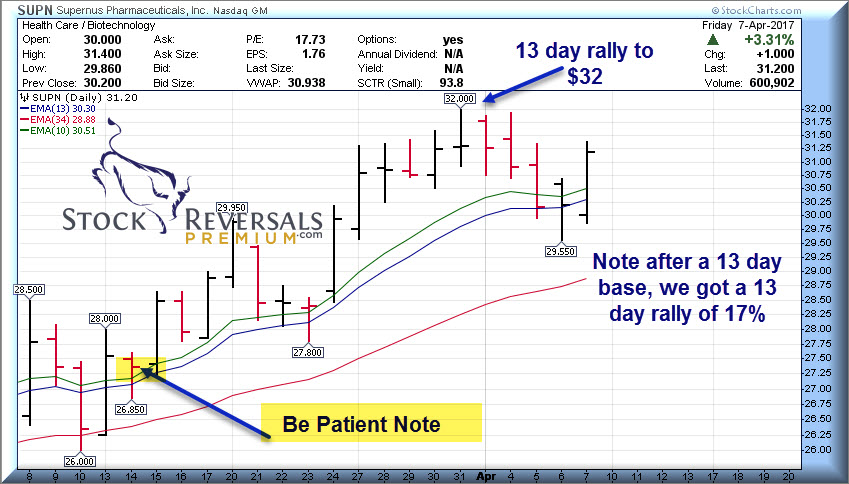
Now if we look at the chart after the one above, we can see a 13 day rally actually began the next day taking the stock up about 17%. That’s a swing move if ever we saw one. This was a good recent example of combining fundamental analysis with technical’s and a base patter to get in front of a swing move to the upside: You’ll note it corrected for 5 Fibonacci days after the 13 Fibonacci day rally…
Swing Trade Ideas: 17 names and notes
Each week we like to put together a list of strong fundamental companies with nice base patterns that may be great for a swing trade ahead. This week we have 17 of them… If you are still not yet an SRP member, get off your chair and join up today!
CELG- 6 Week base on base pattern, cup and handle, great fundamentals, PE 21, Profits growth 35% recently
AMAT- 4 week base pattern for this Chip Equipment leader, PE 18, strong growth, new markets
DVMT- Tracking stock created when Dell merged with EMC, 10 week base pattern
CAVM- 5G upgrade beneficiary, chip maker, 5 week base pattern
AEIS- 4 weeks tight base, power transformation producer, PE 21
BEAT- Pullback this past week, 7 week corrective base, $27 key support. Remote monitoring of cardiac patients
TEDU- 5 week base for the Chinese education provider
SBGI- 7 week corrective base for this media play
BABA- Alibaba needs no introduction, 7 close to a multi month base breakout
TLND- SRP position, Talend Software integrates Data and Cloud applications, close to big breakout post IPO
GDOT- Green Dot is in the money business… nearing highs
CRUS- Riding the back of Apple products, breaking out of base
ZAYO- Bandwidth and infrastructure services, coming out of nice corrective base
ILG- Vacation ownership, near highs
GTN- Broadcasting properties, 6 week base
SSP- Media, Networks, newspapers… 6 week base
SRP TIME!!! 81% profitability rate YTD through 4/6/2017 for our Swing Trades!
Read up and join today – See what our customers are saying, our full track record, sample alerts and reports and more.
“I really like what you’re doing (and it’s not just because you’re on a hot streak right now). I feel like you have the whole package – solid fundamental and technical expertise – combined with a very realistic grip on trading psychology.” A.W. – Senior Vice President-Investments, Stifel-Nicolaus and Co. NYC 3/28/17- SRP Member
Check out our swing trade service where we provide research, reports, entry and exit alerts via SMS and Email, plus morning reports, market forecasts daily and more! www.stockreversalspremium.com
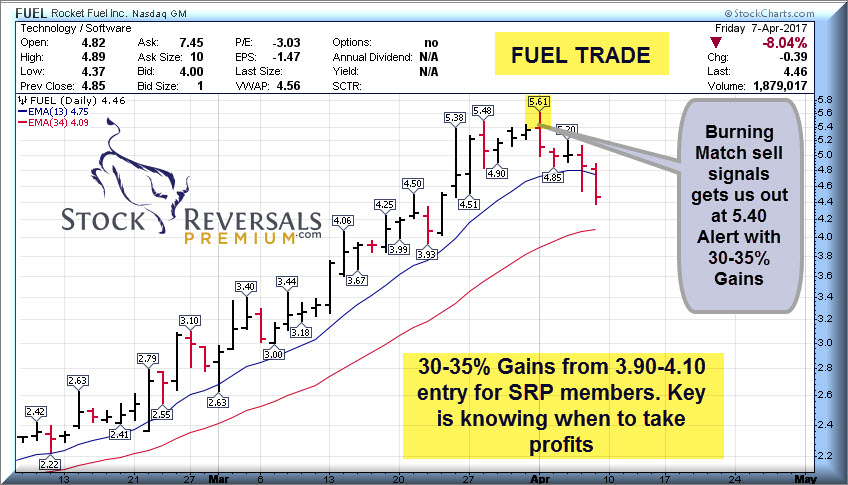
Burning Match Sell Signal from last week: FUEL
Know when to hold, and when to fold… key to long term profitability as a swing trader!
Behavioral Patterns determine markets reaction to news: April 9th turn window here
Markets ended the week a little unsettled following the Syrian Bombings and Jobs report, but we focus on behavioral patterns in our forecasts, not so much news. What really matters in terms of market direction is the phase of Elliott Wave pattern we are in and therefore how the crowd will react to or perceive news. If the news is considered negative such as the Syrian attack and the market doesn’t drop hard, you are likely still in a bullish wave cycle pattern. Overnight futures were down more than 20 points but the market ended the day essentially flat on Friday.
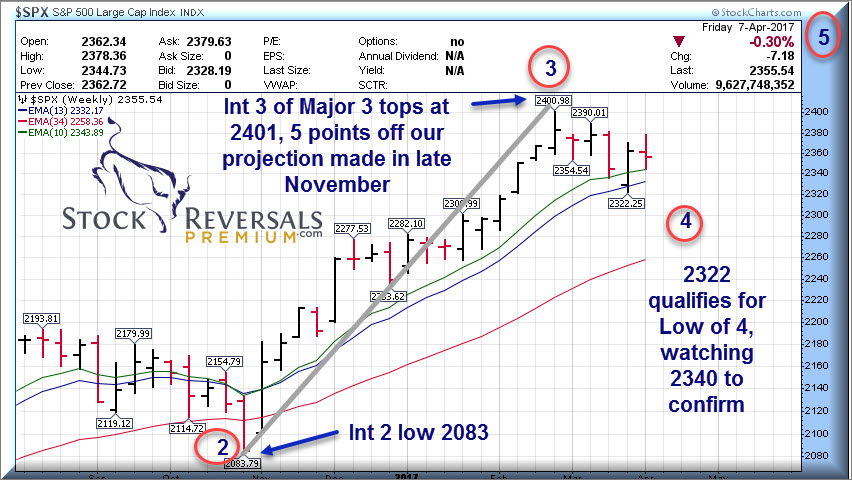
Right now our opinion is we are in a Major Wave 3 up from the 1820 Primary 4 2016 low. There are 5 Major Waves, with 1 , 3, and 5 up and 2 and 4 corrective. This means overall it’s a Bullish pattern with corrective waves within. We are trying to confirm if we finished Wave 4 corrective within Major 3 yet or not.
Near term there is risk that we could see one more “C” Wave pullback to 2300 area as part of Wave 4 down if the 2340 area breaks. Consider 2340 is our line in the sand if you will and if that holds then 2443 is our next zone on the upside as Intermediate 5 up of Major 3.
Bottom line? Keep an eye on 2340, if pierced on the downside evidence is for a test of the 2300 area before a substantial and lasting rebound can continue.
Don’t get too Bearish is our point if you see a 55 point drop this coming week as our Turn date is April 9th as we outlined two weeks ago. – Dave, Chief Strategist
If we hold 2340 and rally past 2378 then we are on the way to 2443.
GOLD- 1257 has been our line in sand
If Gold can take out 1257 on a closing basis then a rally to 1283 is in tap as we have been discussing. We tried on Friday post Syrian Bombings but got rejected at the former 1267 highs:
Without confirmation over 1257 we are on sidelines in terms of NUGT trades right now
OIL- Holds the $47 long term uptrend line
Refiners tend to shut down in the latter winter months for maintenance to get ready for the summer demand season. As they come back online, demand for Oil feedstock picks up and Oil rallies. This is what we are seeing last two weeks or so as the uptrend held with a triple bottom at $47
XBI ETF- Biotech
Biotech remains in a C wave of an ABC Corrective pattern. We discussed back on March 28th that we could at some point wash down to the 65-66 area on XBI, and this past week we moved in that direction. Therefore this is still a typical correction unless 65 breaks hard. We have stayed on the sidelines in terms of LABU ETF trades for a few weeks now. We have had good success with some other names like SUPN for example.
Good luck with your trading in the week ahead!