Stock Reversals | Futures Trading Stocktwits Service
A Free Stock Advisory and Market Forecast Subscription Service
stock market, market forecasting, sp500, elliott wave theory, forecasts, stocks, trading, swing trading, ETF Trading, Gold, Oil, Biotech, Technology stocks, stock research, growth stocks
2247
page-template-default,page,page-id-2247,ajax_fade,page_not_loaded,,qode-theme-ver-10.1.1,wpb-js-composer js-comp-ver-5.0.1,vc_responsive
 

A Subscription service of The Market Analysts Group, LLC


Premium E MINI Futures Trading room in Partnership with Stocktwits.Com  

*Track Record, FAQ and Room Member Notes below

Direct Room Link (Use to Join once registered on Stocktwits) Must join off the desktop browser, then download the Stockwits App for notifications.

Register free at Stocktwits.com as Member, then join for $50 a month! Click Stocktwits Logo to Register!


Morning Advisory daily with ES charts, SPX charts, and Elliott Wave based and human behavioral patterns incorporated to Alert trade set ups with entry, exit, stop loss, and ongoing advice.

Too busy to trade?

Join my Auto-Trade service which handles execution on all trades.  Read up at ESALERTS.COM

*Net points since Oct 22 2018 Inception +662 through 4/19/2020 on Stocktwits Service

  • Each 1 point move in SP 500 is $50 in ES E MINI Futures contract ($14,000 per contract) or $5 on a Micro Mini ($1,400 per contract) as of 4/19/20 pricing

*Disclaimer: CFTC RULE 4.41 All Trades below are Hypothetical as we sent instructions and parameters but cant be assured how each person ended up executing on their own outside of the Auto-Trade platform. See disclosure at bottom of page.


Direct messages from Stocktwits Futures Members:


Recent 
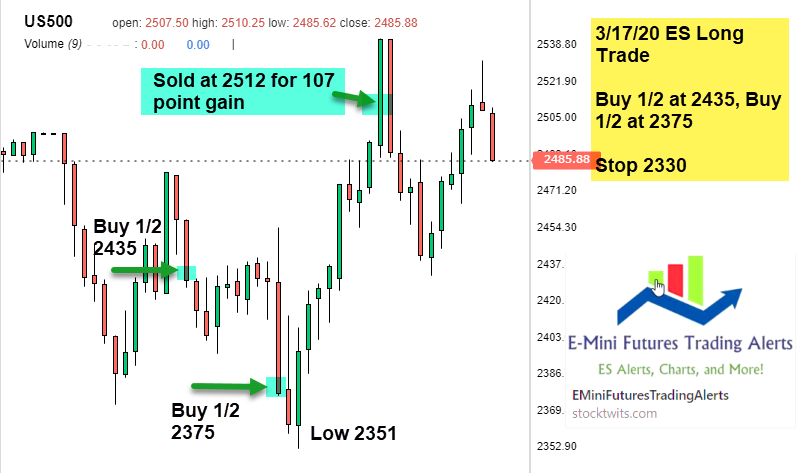
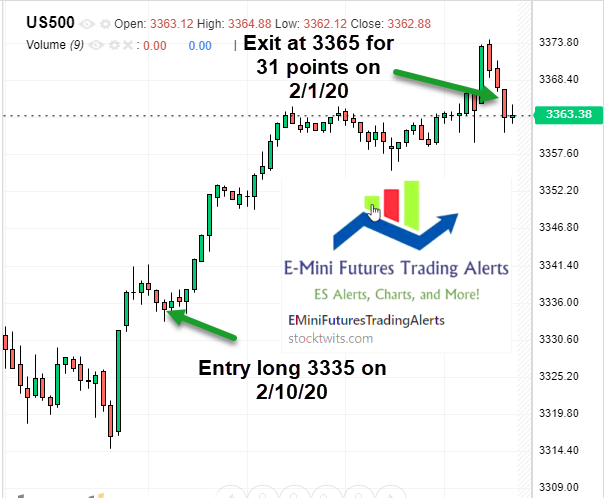
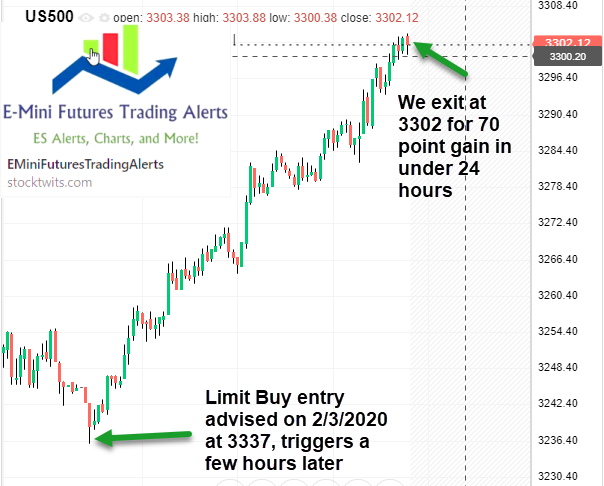
Trades closed on 3/17/20, 2/11/20, 2/4/20, and 1/27/20

107 Point Gain in 1 day going long ES in two tranches (Sold at 2512, 1 day later hit 2262)


31 Point gain in 24 hours going long ES from 3334 to 3365.  We closed it 1 day later for 31 points or 25% gain!


65 Point gain in under 24 hours going long ES from 3237 Limit Buy order, we closed it  the next day at 3302 for 65 points!


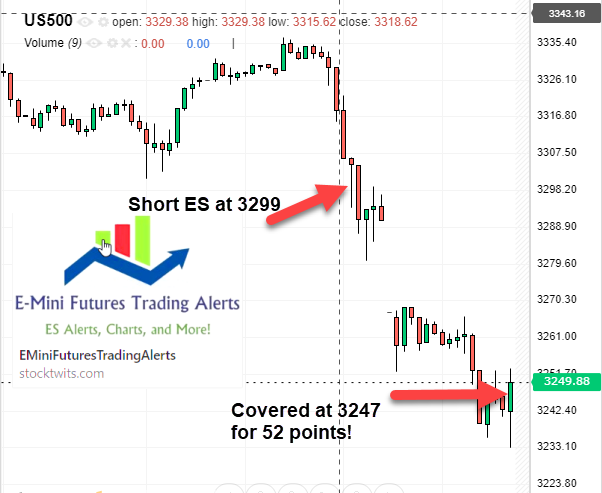
52 point gain in just over 24 hours shorting the ES as I projected a Wave 4 correction in advance. Entered at 3299 on Friday afternoon and closed at 3247 Monday morning


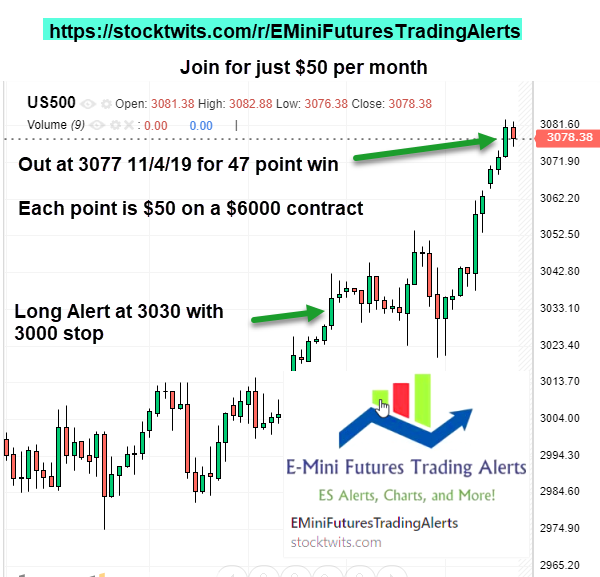
 Trade closed on 11/4/19 for 47 points


Click to Review FAQ Page


*Disclaimer: CFTC RULE 4.41 All Trades below are Hypothetical as we sent instructions and parameters but cant be assured how each person ended up executing on their own outside of the Auto-Trade platform. See disclosure at bottom of page.

*Track Record since Oct 20 2018: Updated 4/19/2020 (Scroll down for full record)

Net points since Oct 22 2018 Inception +662 points through 4/14/2020

Each point is $5 on a $1,550 contract (Based on 3120 SP 500) Micro-Mini’s

Closed out trades:

Week of 8/24

Gain of 20 points (long 3448-3468)

Week of 8/17

Loss of 28 points

Week of 8/3

41 Point Gain Long ES (3274-3315)

Week of 7/26

No official trades, just guidance

Week of 7/19

45 point gain long ES (3015-3060)

15 Point loss short ES (3055-3040)

Week of 7/6:

65 point loss long ES

Week of 6/29:

40 point gain long ES (3085-3125) 24 hours (About 13% gain in 24 hours)

Week of 6/22:

30 point gain shorting ES (3070-3040, low of 3005)

Break Even trade (Stopped out at Break Even at 3090  going long)

Week of 6/15:

86 point gain on final 1/2 of ES going long (3025-3111)

65 point gain on 1/2 ES going long (3025-3090)

Week of 6/8

60 point gain shorting ES From 3180 entry to 3120 Profit Target (1 day)

Week of 6/1

45-73 Point Gain going long ES (3044-3090, 3117)

Week of 5/27:

40 Point Loss going long ES

Week of 5/20

47 Point Gain Long ES (2925-2972)

Week of 5/11

52 point gain going Long ES

Week of 5/4:

9 Point loss going short ES, closed 1 day later

25 Point Loss going short ES

Week of 4/27:

40 Point Gain long ES 4/28/20 closed 1 day later

Week of 4/20:

Break Even trade closed 4/25/20 same day

20 Point Gain long ES 4/22/20 closed same day

Week of 4/13:

25 Point Gain long ES

Week of 4/6

44 Point Gain long ES

5 point loss Short ES

Week of 3/30:

140 Point Loss on 1/2 position going long ES

11 Point loss going short ES

Week of 3/23: 

45 Point Gain going long ES 2455 to 2500, stopped out on pullback same day

94 Point Gain going long ES from 2331-2425, Sold same day

Week of 3/16
107 Point Gain going long ES 1/2 at 2435, 1/2 at 2375, Sold at 2512 same day

Week of 3/9 (Crash Week #3)- Net Gain 9 points

26 Point Loss going long ES on 3/11

35 point gain going long ES on 3/9

Week of 3/2 Crash Week #2- Net Loss 17 points

15 Point Gain long ES on 3/6

22 Point Loss short ES 3/5

10 Point Loss long ES on 3/3

Week of 2/26 The Market Crash week:

Net Loss 20 points for week

Loss of 25, Loss of 9 and 1/2 position Loss of 23 (11.5 equivalent)

Gain of 25 for net loss of 20 points for the week of a historic crash

2/19/2020- Closed 30 point gain LONG ES

2/14/2020- Stopped out ES for 16 point Loss shorting ES

2/11/2020- Closed 31 point  gain LONG ES

2/4/2020- Closed 65 point gain LONG ES

1/30/2020- Closed 18 point gain SHORT ES

1/27/2020- Closed 52 point gain SHORT ES

1/13/2020- Stopped out for 15 point Loss Shorting ES

1/2/2020- Stopped out for 23 point loss shorting ES

12/24- Closed 24 point gain LONG ES

12/12- Closed 22 point gain LONG ES

12/9-  Stopped out for 12 point loss (LONG ES)

11/27 Closed 25 point gain LONG ES

11/15 Closed 28 point gain LONG ES   

11/4- Closed 47 point gain LONG ES

 Futures trading is speculative, involves a high degree of risk and is not suitable for every investor. You should carefully consider whether trading is appropriate for you in light of your experience, objectives, financial resources and other relevant circumstances. Past performance is not necessarily indicative of future results.

 Disclaimer: CFTC RULE 4.41 – HYPOTHETICAL OR SIMULATED PERFORMANCE RESULTS HAVE CERTAIN LIMITATIONS. UNLIKE AN ACTUAL PERFORMANCE RECORD, SIMULATED RESULTS DO NOT REPRESENT ACTUAL TRADING. ALSO, SINCE THE TRADES HAVE NOT BEEN EXECUTED, THE RESULTS MAY HAVE UNDER-OR-OVER COMPENSATED FOR THE IMPACT, IF ANY, OF CERTAIN MARKET FACTORS, SUCH AS LACK OF LIQUIDITY. SIMULATED TRADING PROGRAMS IN GENERAL ARE ALSO SUBJECT TO THE FACT THAT THEY ARE DESIGNED WITH THE BENEFIT OF HINDSIGHT. NO REPRESENTATION IS BEING MADE THAT ANY ACCOUNT WILL OR IS LIKELY TO ACHIEVE PROFIT OR LOSSES SIMILAR TO THOSE SHOWN.


12/9-  Stopped out for 12 point loss (LONG ES)
11/27  Closed 25 point gain LONG ES
11/15- 28 point Gain going long (3084-3112) (*7 days)
11/4- 47 point Gain going long (*3030-3077)
10/18- 13 point Loss going long
10/16- 29 point Gain going long
10/5- 10 point loss going long
9/18 10 point loss going long
9/11- 10-45 point gain going long
9/5- 10 Point Gain Long  
9/2- 3-5 point gain Long  
8/21- 1 day 25 point gain Long   (2895-3020)
7/29- 3 day 5-8 point gain Long   (3012-3015 to 3020)
7/16- 1 day 7 point loss Long   (3018-3011)
7/3- 1 day 16 points Long   (2968-2984)
6/18- 1 day 31 points long   (2896 to 2927)
5/6- 1 day 13 points long   (2902-2915)
5/1- 1 day 18-20 points long
 3/28- 1 day -24 points shorting
 3/25- 1 day +15 points shorting
 3/12- 2 day 23 point loss shorting
 3/1- 1 day -19 points shorting
 2/26- 1 day +15 points shorting
 2/12- 1 day -14 point loss
2/7/19- 1 day +16 points shorting
 1/31/19- 1 day +24 points long
 1/22/19- 1 day for +19 points shorting
( Trades from inception to 1/22/19):
 Wins- 89, 50, 50, 25, 16 
 Losses- 16, 13, 11, 13, 24, 8, 22 
CFTC RULE 4.41 – HYPOTHETICAL OR SIMULATED PERFORMANCE RESULTS HAVE CERTAIN LIMITATIONS. UNLIKE AN ACTUAL PERFORMANCE RECORD, SIMULATED RESULTS DO NOT REPRESENT ACTUAL TRADING. ALSO, SINCE THE TRADES HAVE NOT BEEN EXECUTED, THE RESULTS MAY HAVE UNDER-OR-OVER COMPENSATED FOR THE IMPACT, IF ANY, OF CERTAIN MARKET FACTORS, SUCH AS LACK OF LIQUIDITY. SIMULATED TRADING PROGRAMS IN GENERAL ARE ALSO SUBJECT TO THE FACT THAT THEY ARE DESIGNED WITH THE BENEFIT OF HINDSIGHT. NO REPRESENTATION IS BEING MADE THAT ANY ACCOUNT WILL OR IS LIKELY TO ACHIEVE PROFIT OR LOSSES SIMILAR TO THOSE SHOWN.