


04 Feb Weekly Market Map Forecasts and Trade Ideas Report

Stockreversalspremium.com – Swing Trade service with SMS E-Mail and Post Alerts for entry and exit plus morning pre market updates every day! 70% profitability rate since September 2013 inception! See our full year 2018 results
Tippingpointstocks.com– Growth Stocks with 50-200% upside with our proprietary research!
E-Mini Future Trading Service – Hosted on Stocktwits.com and launched in October 2018. This service focuses on the SP 500 using our market map models and then translates that to Futures Trading advice and alerts. Short term and long term views…morning updates, trades and more. Join for $50 a month!
ESAlerts.com– Auto-Trading SP 500 Futures Service, launched January 2019.
StockReversals.com Members get an exclusive 30% coupon offer to join our SRP Swing Trade subscription service.
Weekly Market Forecast Maps and Swing Trading Ideas Report: Feb 3rd
- Market Analysis – B wave path concluding soon? 2715 hit, 2741 top end
- SRP YTD performance – last 16 closed out trades profitable for 13% average gains!
- Our SP 500 Market Maps are helping to keep us on the right side of the trade!
SP 500 up +370 points in 6 weeks:
- Is the bear market over? Did it end in December 2018?
- Will the market have any sizable pull back?
- How much pullback and what are the targets?
2019 General Outlook (Subject to Change)
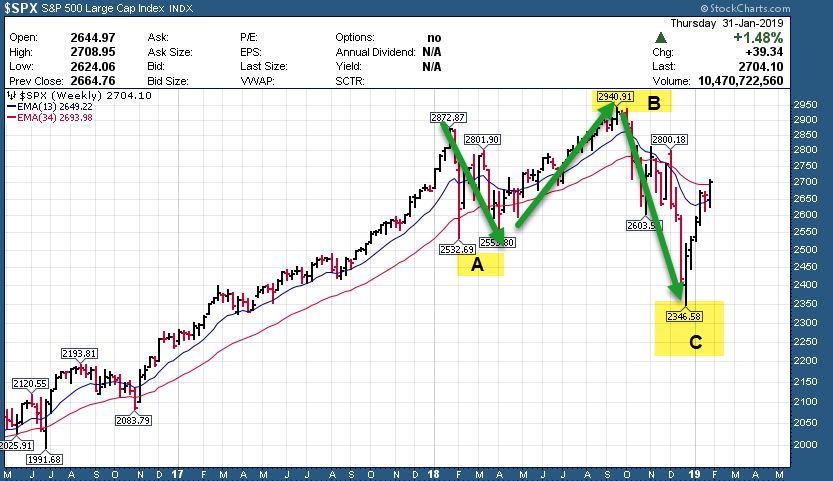
General intermediate view is B wave rally from 2346 continues off the A wave low. This B wave could meander for a few more months even into May 2019 before a larger and firmer C wave down into the 3rd quarter 2019 tests the lows or into the 2000-2100 SP 500 area. Obviously this is subject to change but that is loosely our view now. We are also considering one other pattern that would actually say the Bear Cycle was most of 2018 and ended in late December- Dave, Chief Strategist, Jan 27th
For the week ending Feb 1st, the major indices sputtered higher off Tuesday’s lows to end the week net positive, capping off an impressive 6 week run, seeing 5 of the last 6 weeks positive for total of +370 points gained off the Dec 24th lows.
| Week ending 2/2: | |
| SP 500 | +1.6% |
| Russell 2000 | +1.3% |
| Nasdaq 100 | +1.3% |
| Dow Jones 30 | +1.3% |
Are there any warning signs that the market is running out of steam? On an interim basis, January closed as an inside month to December’s massive bear candle. This means that February or March will need to break above or below December’s high (2800) / low (2346) to see any major resolution. We will be watching.
There is a good chance of a multi week consolidation and pullback in February before we can determine intermediate next large direction. We still believe this is a Bear Market rally off the lows but we do keep an open mind and look for our proprietary clues and indicators to guide us in our Market Forecasting and Mapping if you will. See our Alternate “Bear ended in December 2018” Views at bottom of report
Our Market Map and Elliott Wave pattern analysis continues to be on point, and we have closed 16 of 16 trades profitably for 13% avg gains (prior to the quasi-loss on TBLT from Thursday close out which then rallied up big on Friday). per trade since beginning of January. SRP Swing Trade Members should be up big to start the year. The SRP Model Portfolio is up 20% weighted for total trades closed!!
We know this streak will end at some point, but it’s fun to track thus far. As swing traders, we try our best to determine when to put our foot on the gas and when to take our foot off. There are times to go a bit slower or be defensive when appropriate, and we would not be surprised to see the market start to rotate a bit here.
Since our call for Interim A bottoming at 2346, the SP 500 has rallied 370 points, or nearly +16%.
Many of our open positions in the SRP Swing Trade portfolio are in really attractive weekly base patterns, so please continue to be patient with us. We will monitor and advise as always on a daily basis.
Our year to date performance is shown below.
SRP Model Performance (YTD): Click to Enlarge in new window

The SRP model portfolio has outperformed the SP 500 by 13% YTD! The Russell 2000 index is up 11% YTD, and we are still ahead of the curve on a relative basis.
On to some charts for this week…
SP 500 Charts: Interim B wave in progress, 2713 target met, 2730/2741/ 2757 possible final targets


Biotech (XBI) Chart: bullish consolidation, attempt one more high (last gasp?) before targeting the unfilled gap below. That said, also a possible reverse head and shoulder pattern forming which could be bullish intermediately as well.

Bottom Line:
B wave of a Bear market rally, possible larger C wave in 2019 to test lows or worse?
…OR DID THE BEAR MARKET END IN DECEMBER???? (See our Alternate View)
- Interim Wave B up from the ABC – A to 2346 on SP 500 should be close to completing (or possibly just A of Interim B, (A-B-C – B) A pullback after this coming week would make sense.
- Interim Wave B 2572, 2640 and 2713 targets have been met. 50wma (2730), 200 dma (2741) and a fib at 2757 above.
- Market blew through the downtrend line (not surprisingly), but heavy resistance on all time frames just above.
- 5 of 6 weeks up, 370 points and 15.7% higher = impressive. Most big tech have reported, with GOOGL reporting Monday PM. We expect the market to make bigger moves once these company’s earnings are behind us.
Alternate View: Irregular ABC correction ended in late 2018 for Bear Cycle. We may be the only Elliott Wave forecasters considering this right now, and we like to be early and contrarian.
This is an outside chance that 2346 was the LOW of the Bear Cycle from the early 2018 highs which led to that first major decline in the 1st quarter 2018, and then another major decline in the 4th quarter of 2018. Given that the rally off the 2346 low looks like an impulsive 5 wave rally with a correction now due, we are keeping an open mind that the Bear cycle actually started in early 2018 and ended in late 2018. We put the odds of this at maybe 20-25%, but we are watching for clues.
This is not going to be a year to passively invest in Index Funds. We thank you for your trust in our work to help navigate your accounts positively through all market environments. Our track record is transparent. Continue to stick with us, as we will continue to lean on our Market Maps to guide us through the next cycle leg.
Swing Trade Candidates: Each week we provide 8-15 Swing Trade ideas to consider as part of our SRP service. We often pick a few from the list during the week as actual alerts. We have 15 names this week.
AYX – 4 week base near all time highs. Company is a self Service data analytics platform for businesses.
ZS – Ascending 4 week base near all time highs breaking out of a multi month pattern. Company is a global architecture for Security.
DATA – 10 week base near highs, earnings out early this week. Dave called this “The next Microsoft” back at $50 per share a few years ago, now nearing $130. Company provides business analytics software products.
BEAT – 4 week ascending base near all time highs breakout. Company involved in medical device monitoring business, growing quickly.
FTNT – Double bottom weekly base pattern, breaking to upside on right side of base. Company provides broad, automated, and integrated cybersecurity solutions worldwide.
PLNT – 4 weeks tight base nearing all time highs. Company franchises and operates fitness centers.
HZNP – 13 week overall base near 52 week highs breakout. Company provides medicines that address unmet treatment needs for rare and rheumatic diseases in the United States and internationally.
TREX – 4 week base on right side of multi month base, could break the upside. Company manufactures and distributes wood/plastic composite products, and related accessories primarily for the residential and commercial decking, and railing applications in the United States.
PYX – Attempted weekly breakout last week on heavy volume, backtesting now. Company offers products in the leaf tobacco, e-liquids, industrial hemp, and cannabis industries.
ACB – Double bottom weekly base pattern, breaking to upside on right side of base with heavy volume. Company’s products consist of dried cannabis and cannabis oil.
EOLS – IHS breakout on weekly, looking at 21, 24, and 26 targets. Company provides medical aesthetic products for physicians and their patients in the United States.
VERI – heavy weekly accumulation at new lows, signaling a turn. Company provides artificial intelligence (AI) and computing solutions.
MRIN – double inside week on low volume = consolidation. Company’s platform allows marketing professionals to manage their digital advertising spend across search, social, and display advertising channels.
ZAYO – high consolidation inside week suggests higher. Company provides bandwidth infrastructure solutions for the communications industry.
EROS – heavy short interest + weekly breakout could extend all the way to 10.5-11.25. Company together with its subsidiaries, co-produces, acquires, and distributes Indian films in various formats worldwide.