


13 May Weekly Market Map Forecasts and Trade Ideas Report

StockReversals.com Members get an exclusive 25% coupon offer to join our SRP Swing Trade subscription service.
We offer 4 subscription services for Active Investors
Swing Trading with a 70% success rate since 2013, Growth Stocks with 50-200% upside (3 triples already in 2019), E-Mini SP 500 Futures guidance and alerts on Stocktwits.com and finally ESAlerts.com for Auto-Trading execution of SP 500 futures.
Read up on all 4 at TheMarketAnalysts.Com and get a 25% coupon to try a few of our services.

Contact Dave with any questions (Dave@stockreversalspremium.com)
Weekly Market Forecast Maps and Swing Trading Ideas Report: May 13th
Big Picture: 10 year Monthly chart we published on Stocktwits.com on Friday for our Futures Trading group re-posted here, shows more upside long term ahead likely:
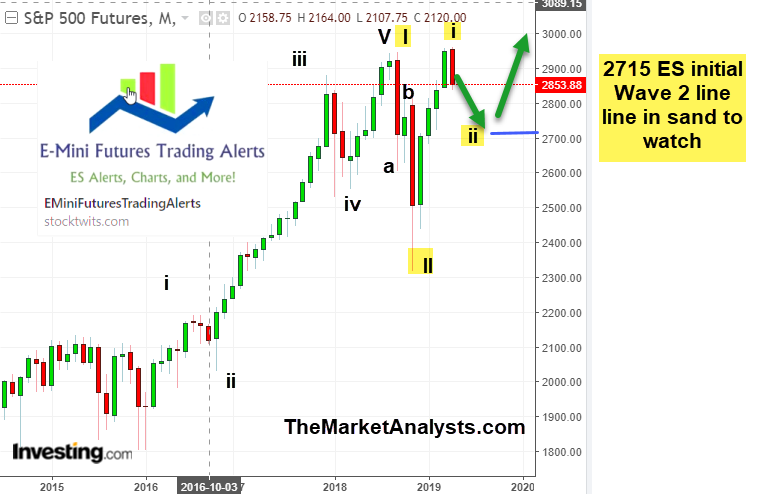
Market Analysis – Possible Wave 2 pullback underway from 2957 highs off Dec 2018 Lows- ABC pattern, with B up on Friday late day….
In this week’s Weekly Market Forecast Maps and Swing Trading Ideas Report, we will be:
- Reviewing “Risk On” Assets
- Looking at volatility
- Sharing our next targets for the SP 500
For the stock market trading week ending May 10th, the broad markets took a pause for consolidation and closed negative for the week, despite rallying significantly off Friday’s lows. The markets were trying for a 5th consecutive red day, however, the rally on Friday left the bears fumbling a little bit.
We identified a beautiful falling wedge in our ES Alerts room on Stocktwits.com. In fact, we said to watch for lows around 2810 and a rally to 2900, we hit 2825 and rallied to nearly 2900 intra-day! Consider joining for morning market commentary, forecasts, and updates during the day plus real time trade alerts! (Friday chart below), which played out nicely for about 36 points higher from our chart (and 67 points off the morning lows).
SP 500 Futures Trading: Just $6,000 per contract suitable for IRA and Non-IRA Assets

The market sold off last week on pessimistic news regarding tariff negotiations, and as we’ve said, the market doesn’t like uncertainty. Nevertheless, the correction has been long overdue, and we wouldn’t be surprised with another one or two weeks of choppiness before working its way to higher targets.
We can’t say enough good things about the individual stock setups we are seeing under the surface. This is exactly the time to be going over a watch list of names that have pulled back over the recent weeks. In fact, we issued 2 new swing trades early last week and we expect to add a few more early this week. Stay tuned!! Markets are still rewarding good earnings reports.
We remain bullish going into the summer, and there should continue to be excellent swing opportunities for our SRP Swings, and great intermediate to long term buys for our TPS service.
| Week ending 5/10: | |
| SP 500 | -2.2% |
| Russell 2000 | -2.5% |
| Nasdaq 100 | -3.3% |
| Dow Jones 30 | -2.1% |
Reviewing “Risk On” Assets
Bigger picture, with the markets coming off their highs, it’s important to see to what degree the risk on assets have participated in this rally and where they stand relative to support. As you can see from the chart below, all of the major indexes are above their monthly median average (20 MMA), and biotech is really the only sector that is lagging slightly. In the chart below, we’ve listed some of the asset classes that are barometers for “Risk On.”
(click chart below to enlarge)

Looking at Volatility
Volatility spiked large last week surpassing (briefly) the 200dma before closing Friday back below. We expect volatility to continue, but keep in mind, this is where the money is made. Our eye is on a variety of watchlist of high flying names we can capture good entries in. This should be a very active couple of week for us in sifting through the best opportunities for SRP.
VIX chart:

What are the next targets for the SP 500?
If a Wave 2 we could see 2810-15 area (2825 hit already) and to as low as 2715-2722 area.
The market didn’t quite reach our 3000 market on this upthrust, so we are slightly modifying our map, with just as bullish an alternative. With last week’s decline being as steep as it was, we’ve likely concluded the first leg higher off the Dec lows and now working on a deeper consolidation wave 2 which is often an A down, B up, C down pattern. This could conclude around the 200 day moving average give or take. We’ll know more as we see price action unfold this week.
Here is a chart we put out on twitter Friday (notice the 10:20 am timestamp on the chart, BEFORE the market rallied nearly 70 points off the low of the day).

We continue to believe in this bull run and will use every pullback to buy into some stocks that we like that might have already run or are getting ready to run, especially in our SRP and TPS services.
That said, we may see a short term rally into next week and likely correction of some degree into the rest of May, setting up the summer for another run. If this is a wave 2, we may have more work to do on the downside, but that should set us up for Wave 3 up, if we didn’t start already on Friday.
With the 34 Day MA broken on a closing basis, we will look to the weekly 13 and 34 day EMAs from this point forward with our eye on the 34 Week EMA just below 2800. Pay attention to our morning reports this week, as we will navigate the markets for you!!
On to some charts…
SP 500 Charts: Major Wave 2 in progress, B wave and C to follow? B wave should find resistance between 2900-10. Will map out from there, and we are bullish into next move higher. Again, have to monitor, evaluate, and adjust as needed.
Potential to 2715 area if the Wave 2 picks up steam ahead after a bounce…


Biotech (XBI) Chart: Multi week consolidation looks like, but still inside the candle from 4 weeks ago. No man’s land until <82.50 or >92.50. There is still an open gap below.

Bottom Line:
- Market made new all time highs, with only half the sectors making highs above 2018 highs.
- Watching to see if Russell 2000 and other Risk On assets can continue to participate.
- Alternative Bullish Count is our our preferred count (See 4/14 Weekend Report where we originally posted).
- Stock Pickers market, don’t confuse our SP 500 charting with Swing Trading opportunities unless we are in a Major Wave lower (which we are not currently)
- ABC correction off the 2957 highs is normal, the low around 2825 so far. 2715 area possible on the low end.
Swing Trade Candidates: Each week we provide 8-15 Swing Trade ideas to consider as part of our SRP service. We often pick a few from the list during the week as actual alerts.
Last Week ZS broke out with a 9% upside move after being on the list a few weeks in a row. Also GH broke to the upside 10% for the week on positive news, had been on the list 3 weeks in a row in a base. BLD also broke out off our list last weekend with a 12% weekly gain.
We have 13 names this week, 7 repeated from last week.
ORHOF – CHART LINK
Origin House- (You get .8428 shares of CRLBF for each share of ORHOF on closing) . This is therefore trading at a 14.5% discount arbitrage wise to the planned merger with Cresco Labs, which should close on June 13th. Buying shares of ORHOF gives you a discounted entry into CRLBF, one of our favorite long term cannabis plays. Both in 8 week base patterns.
TGNA – CHART LINK
4 weeks tight near 52 week highs and pulled back to 10 week line this past week of May 3rd. Company operates 49 TV stations and affiliated websites.
SE – CHART LINK
Consolidation at 52 week high breakout. 3 week formation on the weekly. Company engages in the digital entertainment, e-commerce, and digital financial service businesses.
CZR – CHART LINK
6 weeks base forming right side of inverse H&S. Casino and gaming company. Survived market drop last week for now.
CGC – CHART LINK
16 week base looking like it wants to push higher, pulled back 3% with market last week. Company engages in sale of medical cannabis in Canada.
TW – CHART LINK
Post IPO cup and handle, looking for new highs. Company builds and operates electronic marketplaces.
PINS – CHART LINK
Strong relative strength despite market selloff, consolidating sideways should see run to test 33. Company provides a visual discovery engine that helps users to discover ideas for various projects and interests worldwide.
COUP – CHART LINK
Pop off double weekly bottom on strong volume last week. Company provides cloud-based business spend management platform.
MDB – CHART LINK
Gorgeous 8 week base along 13wma, coiled for higher. Company operates as a general purpose database platform worldwide.
NOW – CHART LINK
Post earnings gap and consolidation and now moving higher. Company provides enterprise cloud computing solutions.
ZEN – CHART LINK
Ascending base pattern on the daily, looks locked and loaded. Company provides software development products for organizations.
GPN – CHART LINK
Tight 3 week base riding the 13dma. Company provides payment technology and software solutions.
PYPL – CHART LINK
Tight 3 week base on sideways consolidation, holding 34 ema. Company operates as a technology platform and digital payments company.