


19 May Weekly Market Map Forecasts and Trade Ideas Report

StockReversals.com Members get an exclusive 25% coupon offer to join our SRP Swing Trade subscription service.
We offer 4 subscription services for Active Investors
Swing Trading with a 70% success rate since 2013, Growth Stocks with 50-200% upside (3 triples already in 2019), E-Mini SP 500 Futures guidance and alerts on Stocktwits.com and finally ESAlerts.com for Auto-Trading execution of SP 500 futures.
Read up on all 4 at TheMarketAnalysts.Com and get a 25% coupon to try a few of our services.

Contact Dave with any questions (Dave@stockreversalspremium.com)
Weekly Market Forecast Maps and Swing Trading Ideas Report: May 19th
Big Picture: 10 year Monthly chart we published on Stocktwits.com on Friday for our Futures Trading group re-posted here, shows more upside long term ahead likely:
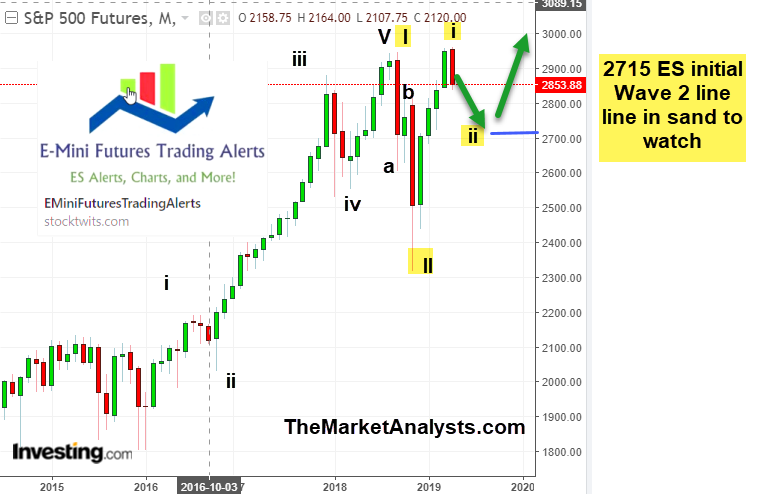
Market Analysis – Possible Wave 2 pullback underway from 2957 highs off Dec 2018 Lows – 2 week consolidation stair step pattern down. Possible B wave high this past week at 2890 area as projected.
In this week’s Weekly Market Forecast Maps and Swing Trading Ideas Report, we will be:
- Reviewing the SP 500 big picture
- Looking at volatility
- Sharing our next targets for the SP 500
For the stock market trading week ending May 17th, the broad markets were down for a second week in a row. We have been talking about a needed consolidation, based on our view of individual names and market maps. After being up +25% off the December lows, the market has only had a 5% decline off the highs, so keep that in mind for context.
For the most part this week, lower overnight action led to regular session gap downs that have seen a rally during daytime hours, only to then gap down the following morning again and rinse repeat. Nevertheless this decline feels orderly to some extent.
See the hourly chart: ABC pattern possibly setting up, if we take out 2900 on a closing basis then we bottomed already near 2800, otherwise looking for a test of 2800 area and or 2765, 2715 as we have been discussing for a week or so.

We are seeing leaders outperform and make new highs, despite the broad markets chopping back and forth. We also are seeing excellent stock setups under the surface, but some just need a little more time to base. We are going to be issuing more swing trades in the coming week, so stay tuned!! Markets are still rewarding good earnings reports.
However, small cap stocks on a relative basis have been under pressure and the IWM ETF has under-performed the larger indexes on a relative basis the last 3 months or so, and with these headwinds (at least in the small cap names), volatility has been high.
We remain bullish going into the summer, and there should continue to be excellent swing opportunities for our SRP Swings, and great intermediate to long term buys for our TPS service.
| Week ending 5/17: | |
| SP 500 | -0.8% |
| Russell 2000 | -2.4% |
| Nasdaq 100 | -1.1% |
| Dow Jones 30 | -0.7% |
Reviewing the SP 500 Big Picture- Monthly Views are bullish long term still
Bigger picture, the market has consolidated for nearly 17 months, very similar to 2015-16, and what always follows consolidation is expansion. This first leg up to 2954 meeting resistance, and the pullback now is much needed as a Wave 2 correction.
SP 500 (monthly):

SP 500 (quarterly):

Looking at Volatility
Volatility formed a divergent lower high on an intraday basis last week as SP 500 made a lower low on Monday’s bottom. As volatility closed the week under 200dma, we continue to watch for signs of a risk on / risk off regime. Volatility can stay elevated even while the markets move higher.
Many of the momentum leaders on our watch list held up very well, which tells us that there is rotation going on and we’re looking for good entries now. This will be an active week for us in sifting through the best opportunities for SRP.
VIX chart:

What are the next targets for the SP 500?
Wave A bottom around 2800 support and now looking to see if B wave has concluded or will be more complex before C wave to follow.
After gapping down -2% on Monday, the market spent the rest of the week rallying off the 2800 psychological and price support, not making a new low. We believe the A wave is finished and either B wave completed this week for a C wave to start or the C wave may have to wait until after the Memorial Day weekend (market tend to be bullish biased into holidays), which would mean some sort of sideways / up movement this week.
We will continue to use every pullback to buy into stocks that we like that might have already run or are getting ready to run, especially in our SRP and TPS services. In our TPS service last week, we took profits on one of our core holdings from earlier this year for 50-70% gains, as we are eager to rotate into some new ideas.
The 13 WMA held on a closing basis, but we have our eye on the 34 Week EMA just below 2800 (right near the 200dma). Pay attention to our morning reports this week, as we will navigate the markets for you!!
On to some charts…
SP 500 Charts: Major Wave 2 in progress, B wave in process. B wave should find resistance between 2900-10. Will map out from there, and we are bullish into next move higher.
Again, have to monitor, evaluate, and adjust as needed. Most likely a C wave down unfolds here soon if not already.


Biotech (XBI) Chart: Consolidation breakdown, relative weakness vs. SP 500 however there is some seasonal weakness heading into ASCO conference end of May. (There is still an open gap below).

Bottom Line:
- Market made new all time highs into late April, with only half the sectors making highs above 2018 highs.
- Watching to see if Russell 2000 and other Risk On assets can continue to participate.
- Alternative Bullish Count is our our preferred count (See 4/14 Weekend Report where we originally posted).
- Stock Pickers market, don’t confuse our SP 500 charting with Swing Trading opportunities unless we are in a Major Wave lower (which we are not currently)
- ABC correction off the 2957 highs is normal, the low around 2825 so far. 2715 area possible on the low end.
Swing Trade Candidates: Each week we provide 8-15 Swing Trade ideas to consider as part of our SRP service. We often pick a few from the list during the week as actual alerts.
Last week, despite all of the major markets posting negative returns, a handful of names from our list did quite well. COUP broke out nicely with a 6% move. Also, MDB was up almost 8%, as had been in a 9 week base. SE and PYPL were up between 2-4% or the week.
We have 13 names this week, 3 repeated from last week as some already broke out.
YCBD – CHART LINK
The only CBD Pure Play listed on a US Exchange. CBD Oil is derived from Hemp Plants and contains no THC, but is being used more and more by consumers and pets. Growth rates are exploding and this is in a 4 week base. (SRP has a position as of last week) Could pull back to 5.50 and then run to 8.50-8.80 in next few months. New product lines coming out shortly.
GH – CHART LINK
We have profiled this at 66, 71, and now its 75 but on a weekly basis, looks poised to run to highs still. Liquid Biopsy developer that could change the standard of care for Cancer Tissue testing. In a 13 week base, near 76 this could run to 100 plus ahead.
SE – CHART LINK
Broke out of 11 week base last week, it has been on our list for 3 weeks now. Still looks good for a run.
TW – CHART LINK
6 Week post IPO base consolidation now near highs again. Company builds and operates electronic marketplaces.
ZEN – CHART LINK
Ascending base pattern on the weekly, holding 13 wma and looks locked and loaded. Company provides software development products for organizations.
ACB – CHART LINK
10 week corrective base, breaking up late last week after a dip below 8 and then a reversal after earnings on strong volume. Company produces and distributes medical cannabis products. This sector has been consolidating for 8-10 weeks on average. Would like to see it hold last weeks low of 7.90 though.
TNDM – CHART LINK
12 week base, so may consolidate one more week and then move up. Weekly cup and handle .Medical device company for people with insulin-dependent diabetes.
VRSN – CHART LINK
4 week base near highs, showing relative strength despite market selloff. Company provides provides domain name registry services and Internet infrastructure.
GPRO – CHART LINK
2 week break to the upside, if this can clear 7.40 it could run. Looks like weekly inverse H&S forming on heavy volume. Company develops and sells cameras, drones, and mountable and wearable accessories.
ESPR – CHART LINK
Breaking up out of right side of base, and could see 55-60 shortly. Company focuses on developing and commercializing oral therapies for the treatment of patients with cardiovascular disease.
IIPR – CHART LINK
Breaking up out of right side of 9 week base. Company focuses on the acquisition, ownership and management of specialized industrial properties leased to experienced, state-licensed operators for their regulated medical-use cannabis facilities.
TWTR – CHART LINK
4 week overall consolidation after gap up, could be a week early, but this is a great setup. Social media platform company. Would like to see it hold $36 area.
SNAP – CHART LINK
10 week base looking great for setup. Company provides camera application that helps people to communicate through short videos and images. Needs to hold that $9.90 area