


11 Feb Weekly Market Forecasts and Trading Ideas Report

The Market Analysts Group, LLC. Publishers of market and trading subscription services:
Stockreversals.com (Opt in for Free reports) Stockreversalspremium.com Swing Trades, Forecasts and More TippingPointStocks.com Growth Stocks with 100% + upside
If not yet a Free Member of Stockreversals.com , opt in here with name and email to get timely reports every week! Follow us @stockreversals on Twitter for updates during the week too!
Weekly Forecast and Trade Ideas Report for February 11th
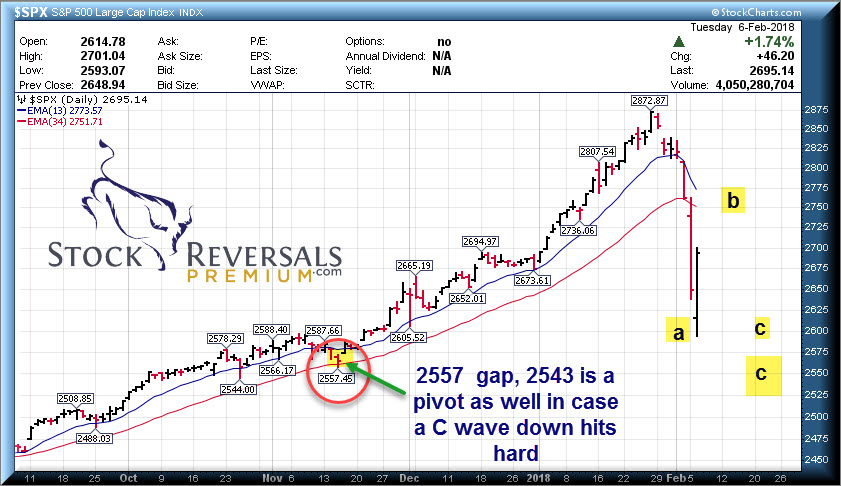
“We are super oversold on many measures we look at so a bounce early next week seems likely, but we would still expect more downside ahead over the next 3-4 weeks as most likely, so be careful not to get sucked into a brief bounce.” February 4th Weekend Report and Forecast
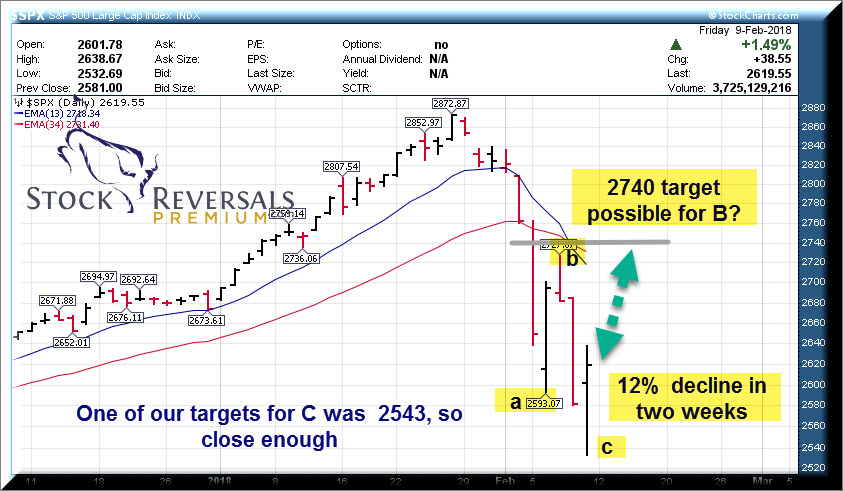
This past week SRP (Swing Trade and Forecast) members were kept up to date on a daily pre-market basis as always on the state of the markets with our forecast models on the SP 500 and other ETF’s. We correctly projected the ABC correction pattern and had projected a B Wave top into Wednesday morning’s report, a C wave drop we said could get to 2543 area and the low was 2532 for a 12% correction so far in two weeks.
Our Wednesday Projection played out:
This type of rapid two week decline is extremely rare, normally they are 4 -6 weeks for shallow corrections and 6-10 for larger corrections in terms of intermediate movements. The reason it was so sharp and so fast is because the Wave 3 pattern we discussed recently was a 200% extension of Wave 1, and it was hyper extended. Sentiment readings for Bulls were through the roof to boot, and a sentiment correction was long overdue.
So this weekend we will just summarize a few indicators that helped us to project a low late in the week and then we went long 300% leverage the QQQ ETF on Friday as well, but still 90% in cash. We were 85% in cash going into the initial major Friday crash of February 2nd, mostly because we didnt replace sold out positions with new positions. We felt the market was too toppy and best to take gains, more on that later.
Here is the updated SP 500 chart where we saw the washout to the 200 day moving average line, a Fibonacci pivot of the 1810-2873 2 year rally, and other ABC patterns that lined up for a low Friday. We can see a bounce now maybe to 2740 area on the SP 500 ahead, but markets could remain tentative here and volatile for a bit.
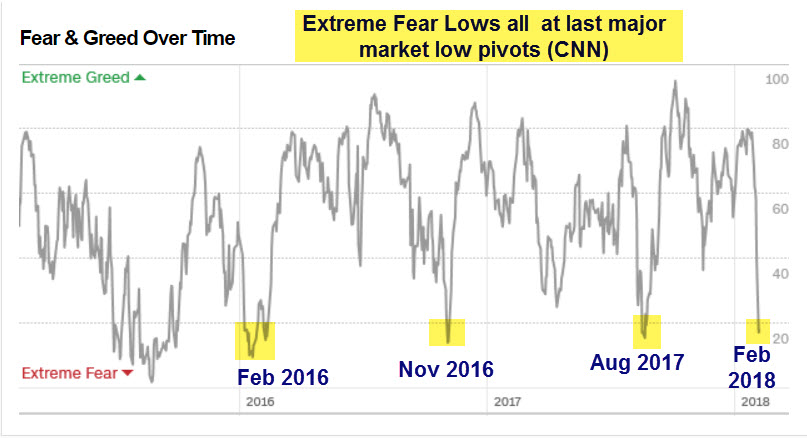
Other indicators we use are the CNN fear/greed index, sitting at major lows going into Friday. something we showed SRP Members late in the week in the morning report: These readings help determine that a market is nearing a pivot low.
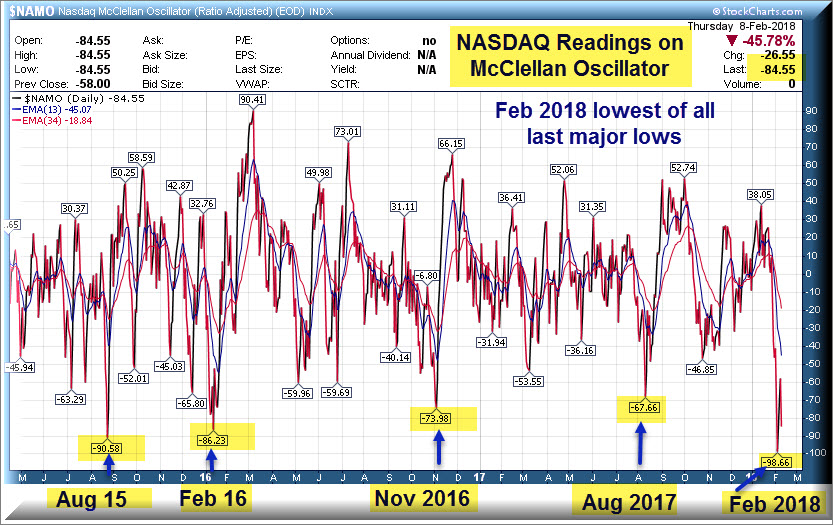
A few others include the NAMO (Nasdaq McClellan Oscillator): We had showed this to SRP members on Friday morning pre market: Partly why we went long Tech stocks via TQQQ for a trade. Lower readings than the Feb 2016 lows in fact!
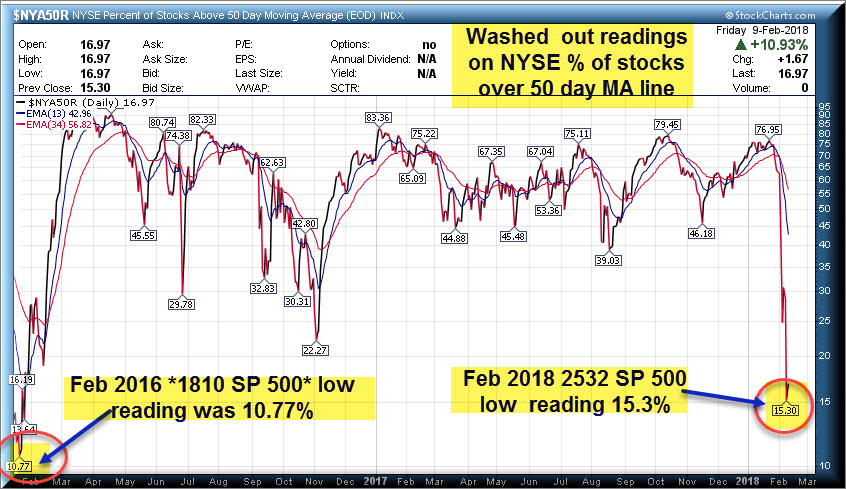
Finally the NYSE indicator shows % of NYSE stocks above 50 day MA lines, this crashed as well: Readings not far off the 1810 SP 500 lows of February 2016!
So this is the fuel that allows us to project a rally to 2740 possibly on the SP 500 index near term. However, since this correction is only two weeks in, often you can a relief larger B wave rally after the ABC-A drop, and then another onslaught of selling which could take us lower than 2532 lows to 2479 area perhaps in the few weeks ahead. We would expect February to remain volatile and with big swings.
It is possible that the correction ended though because we have Fibonacci retracements of the 1060 point rally from 1810-2873, we have the 200 day MA line tested, we have extreme fear readings and more. So we will take it one day at a time at SRP, and Members will be updated every morning as usual.
We are still 90% cash in our model but will likely be adding some positions in the days ahead. There are still stocks doing well, earnings reports are being met with buyers if they are strong enough. Samples include NVDA, TWTR, and SNAP this past week. However, the risk levels of trying to be a hero into an ABC correction are too high, so we sat on our hands all week until Friday morning. Even then we used a 3x ETF play and not an individual stock at this time.
SRP- Our Swing Trade and Market Forecast Service: If you have not looked into joining yet, your missing out on a very profitable experience. 75% of our positions have been closed for profits since September 2013 inception. We had subscribers 85% in cash prior to the Friday Payrolls report mini crash that started the avalanche. We incorporate a contrarian approach to swing trading unlike what most have been taught. A clear focus on both fundamentals and technical’s, using human behavioral patterns to time our entry and exit. This past week closing out one trade for 35% in 7 weeks even with the market decline.
There is a 20% Annual Coupon Code which reduces membership from $749 annually to $599. Or you can join Monthly or Quarterly with a 30% Coupon Code making them $69 a month or $174 quarterly. The Annual option works out to $50 per month. E-mail us for the Coupon Codes or see your Email for this report which has them already listed.
Market Notes:
Looking for bounce as high as 2740 on SP 500, but possible bigger C wave ahead so we will monitor and advise.
Bulls dropped to 54% in Advisory surveys down from 66% on January 21st. However, Bears still only 15%
Mid caps (MDY ETF) and Small caps (IWM ETF) had double bottoms
NYSE short interest is on the decline. We can read that a few ways, shorts are starting to cover, or investors are still too complacent.
CNN Fear Gauge hit big lows near 8 this week, now still at 10 (100 would be max optimism).
17 New highs, 187 New Lows on NASDAQ Friday, pretty washed out
7 New highs and 271 New Lows on NYSE Friday, wow
Swing Trade Candidates: Well everyone is certainly frazzled,but we have compiled some names that look interesting and in some cases we put where key support is as well. We may or may not use any of these for alerts but this is our list for now:
AMTD- Ameritrade in 5 week base, merging with Scottrade, PE 27, growth 50%, $54 key support, 5 week base
MTOR- 18 week base, pullback, PE 12. 25 area support, OEM components
TRHC- 13 week base, 32 is key support. Provider of solutions for drug management for patients
SHOP- 21 week overall base, pullback, 110 key support from 119 area, EPS due 2/15
MDXG- Pullback this past week, 3 week corrective pattern, 14 area key support, Tissue repair
SNAP- 18 is key support after earnings blast up and pullback
LPL- 6 week base pattern, 59 area key support for brokerage firm with independent advisors
SFM- 3 week correction, 25 area key support for sprout farmers market chain
MA- 2 week correction, Mastercard almost recession proof, 160 area key support
WING- 3 weeks tight near highs, 998 wing restaurants
CASA- Recent IPO, 9 week Post IPO base, nice pullback. Software for Cable providers voice,data ,video
JT- 13 week Post IPO Base, China Fintech Platform growing at rapid fire pace, under followed by investors. Insiders bought into the IPO at 8, its trading at 6.50. Goldman Sachs, JP Morgan underwriters
VUZI- 5 week base pattern, pullback to 8.50 from $10 stock offering, Virtual Reality/Augmented reality leader
AZRX- Speculative Biotech play, double bottom, data due in March and Market cap only 34 million