19 Mar Weekly Forecasts and Opportunities Report- Swing Trade Alpha
If you are not yet Opted In as a Stockreversals.com Member, consider getting on board today. Are you ready for something different? Forecasts, Trade Ideas, Long Term Growth Stock reports, and more.
Sign Up with Name and E-mail, we do not share your E-mail address with any entity.
![]()
Hi Dave,
4th Wave correction from 2401 3rd Wave highs continues:
In this edition:
- Specific methods we employ on Swing Trades to get Alpha with low risk
- Samples of NUGT and YIN Swing Trades with charts
- SP 500 Forecast update on Wave 4 patterns
- Updates on Biotech Sector and Forecast chart update
- Gold chart notes and Bull pattern and reversal this past week
- 14 Swing Trade candidates and notes
- Market internals and sector notes
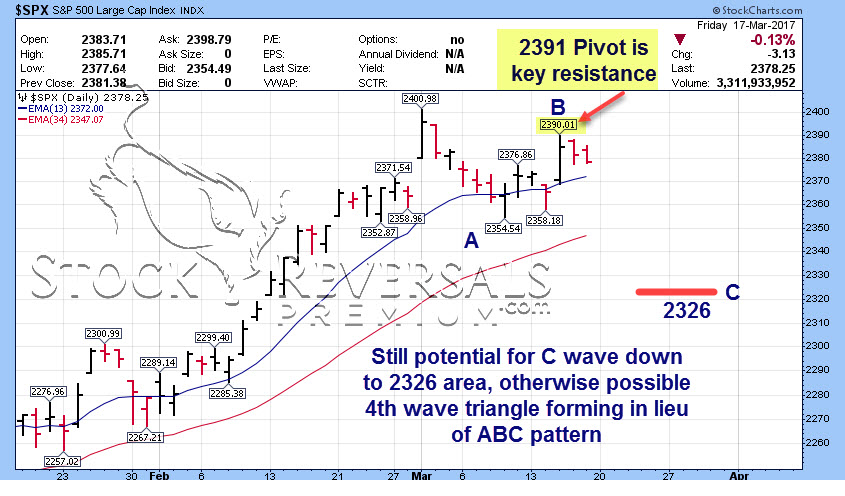
The markets continue to consolidate after hitting 2401 SP 500 highs of Intermediate Wave 3. We have been projecting an Intermediate Wave 4 to as low as 2326 since then. So far we have seen a pullback to 2354, a rally to 2390 which is a Fibonacci resistance zone, and then another pullback late last week. Therefore, we still continue to see this consolidation as a 4th wave correction pattern after a torrid 318 point run.
Normally, a typical minimum retracement of a powerful 3rd wave is about 1/4 of that prior run or 75 or so points from the SP 500 Index 2401 highs. However, to date the pullback has been shallow at only 47 points. This means one of two patterns are forming from the 2401 highs in our opinion and either of them are valid 4th wave patterns.
- A 5 wave “Triangle” which consolidates the prior rally and lets the economics catch up with the market movement.
- An ABC pattern, where so far we have seen an A, then a B to 2390, and now a C to 2326 possible.
In any event, we are into a near 4 week base pattern with 2401 the spike high and 2354 the lows. We remain Bullish on the market and continue to profit from swing trades that incorporate fundamental analysis and chart patterns both.
Below we show an A B and now waiting on either a C down to 2326-2333 area of a continuation sideways of a triangle pattern with 2354 the first wave low.
The end result of all of this is a likely eventual run to yet again new highs and towards the 2500 area on the SP 500 Index as we are still in Primary Wave 5 up from 1810 Primary 4 lows of February 2016.- Dave, Chief Strategist
Swing Trades that get big Alpha:
In the meantime, we can take a look at some of the underlying strongest sectors of late and in many cases try to work within those sectors to garner alpha and gains that beat the index with reasonable risk levels. At our SRP Service we try to focus on sectors that are coming from out of favor back into favor with investors at the critical cusp of behavioral pattern changes.
The best swing trade returns are generally made after a correction pattern has completed and or a key base pattern is winding down. This is the time when most traders and investors have lost interest in a sector or security and is the opportune time to pounce on entries before the crowd sweeps in with buys and pushes an 3x ETF up or a stock up in fast order.
A few samples of what we look for in Swing Trades:
- Good sector or stock base patterns or prior corrections completing
- Investors have lost interest and are not hot on the area or stock
- Strong fundamentals not recognized
- Lack of coverage or promotion by management
- Great company overlooked in a strong sector
- Quiet message board (Stocktwits not trending)
NUGT SAMPLE: 3x ETF trades for big gains even with volatility- Stops are Key!
We saw this type of washout and reversal pattern recent on the NUGT ETF, which is a 3x Bull Gold miners ETF. We like to use 3x ETF swing trades often as they remove single stock risk. If well timed they let you ride the upswing in a sector like Biotech, Energy, Precious Metals and so forth. We had a deep 50% retracement in Gold recently which worked off the 1124-1264 140 point rally leg. The drop to 1194 was a 50% pullback of that move, and pushed the GDX ETF down 17% or so from highs.
We reverse engineered the base GDX ETF to project a low pivot on it, and then did the math on NUGT and placed our appropriate stop where even if down we knew we could ride it out.
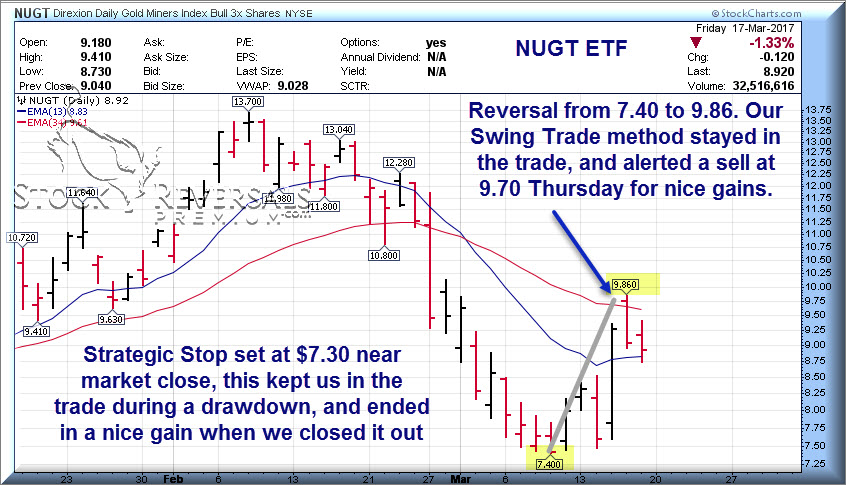
We then entered the NUGT ETF with the expectation that we may see some further decline in GDX to the 21.30 area base on behavioral pattern analysis we did, and therefore we may see NUGT pullback deeper. At SRP we set a strategic stop that is not intra-day but near the closing of the market day instead, this removes the interference of stop loss running noise from our trades.
NUGT fell to 7.40, our stop was set at 7.30 and therefore although we were down on paper on the swing trade… the parameters we expected were still playing out, hence no need to panic and sell at a loss. Then a huge reversal up off the Gold 1194 double bottom pushed NUGT from 7.40 to 9.86 within 2 days and we sent a sell alert at 9.70 on Thursday to close it out for 8-10% gains, and in some cases much more.
We use our “Burning Match” sell signal to try to get out near behavioral tops in ETF’s or Stocks. We saw this at $9.70 on NUGT on Thursday and alerted to sell. It dropped to 8.73 on Friday, 1 day later.
That brings up the current GOLD forecast
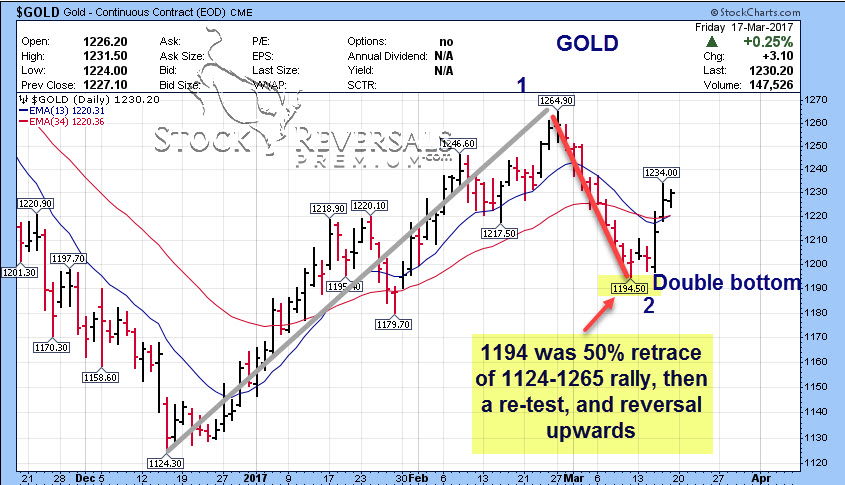
We had a 50% retracement of the 1124-1264 leg, then a re-test last week near 1194. A rally from there ensued because the market prices in news before the news, and the FOMC Rate Decision was baked in at 1194. Shorting Gold or Gold stocks going into the FOMC meeting was actually high risk, not low risk due to the way patterns work. We stayed long NUGT right into the meeting and then profited in the big reversal up.
Here is the updated look at GOLD, which is now much more constructive: Perhaps a Wave 2 low at 1194 has taken hold, the outside lower level we pointed out was 1177 if 1194 did not hold, but it did. This is probably going to be a good area for swing trades ahead.
The financial sector has been strong obviously with the assumption of repeal of the prior legislation and many other measures beneficial to financial companies. The stocks have been consolidating for many weeks, but within the sector there are some values.
Finding Values and Swing Trading: YIN sample 15-22% gains
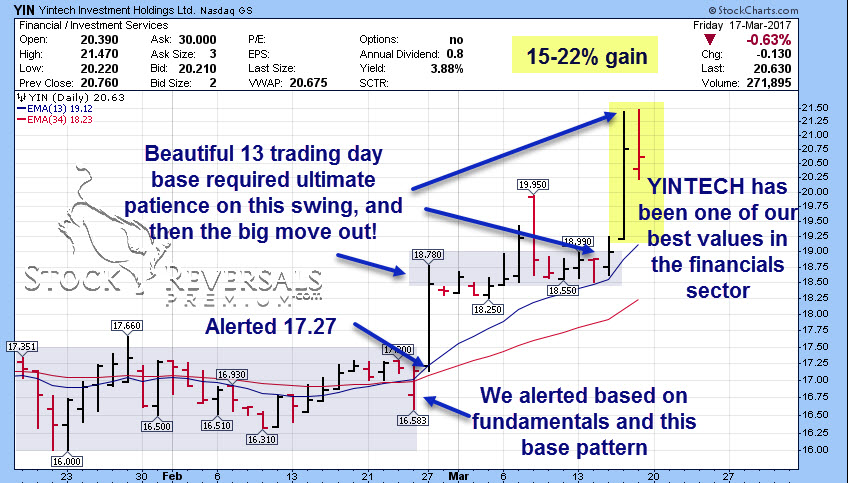
Recently at SRP we pointed out YIN (Yintech Holdings) to our members and wrote up our research and alerted it at $17.27 area. We felt the fundamentals were a screaming buy, but essentially the company does no promotion and investors had not paid any attention to them. These are the type of stocks we like to find before the crowd gets on board, and that is how the beta moves are made with low risk. YIN was trading at 5.6x our 2017 estimates when we backed out the cash per share and with no debt. Recent growth was 65% year over year, so we felt there was minimal downside risk. In addition, it had formed a great base pattern so we had technical’s and fundamentals aligned together at the same time.
The stock popped big following earnings recently to 21 pre-market, then pulled back and consolidated for many days. We rode that consolidation and then finally late last week the stock popped big on volume. This put SRP members up anywhere from 15-22% in a few weeks time.
Note the base on base pattern, theses often lead to another breakout assuming the fundamentals warrant it
Market Notes:
- Building and Construction stocks remain strong, indicating a sound economy
- Top Sector Funds YTD: Biotech, Technology, Computers, Wireless, Chemicals, Banks
- Bulls 53% in Advisory Surveys down from 63% two weeks ago at Intermediate 3 highs. Bears 17.5%
- SP 500 in a 19 day near 4 week base pattern
- NASDAQ- Short term daily chart in a 3 days tight pattern, often leads to big moves
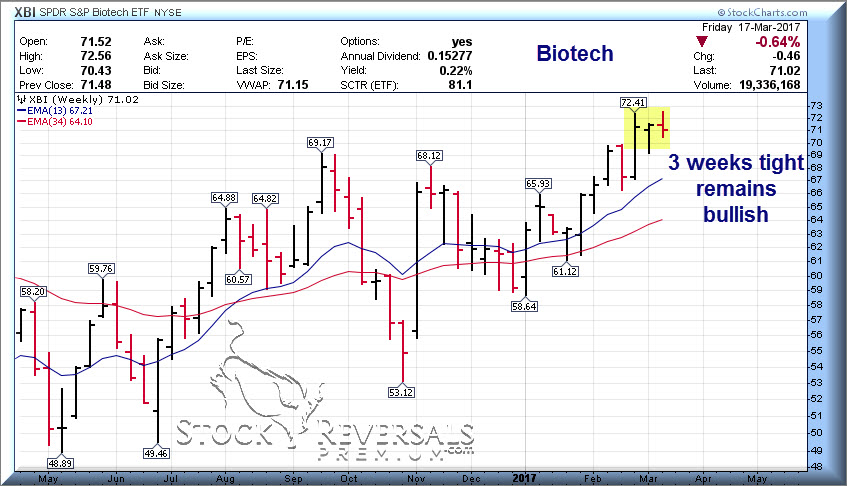
Biotech Update: XBI ETF Chart and Notes
This has been a sector we have been pounding on for many weeks as bullish in terms of the XBI ETF patterns. At our SRP service we have worked with LABU ETF for some nice trades, and recently adding some individual names in the sector as current swing trades that are open. We again here prefer companies with a product on the market, a pipeline that is decent, good management and balance sheet, profits, and growth as general rule of thumb.
Below we see a 3 weeks tight base pattern on top of a prior triangle base pattern. No reason to be Bearish right now and we have an open LABU position recently alerted at SRP, with plans to add on dips.
Watch List:
We like to produce a watch list every Sunday of 12-18 stocks and or ETF’s that guide us with some ideas ahead. Below is our list this week, and we often drill down further into the fundamentals and chart patterns before they make the cut for an SRP Swing. We are near 80% YTD in profitable trades closed out, and last year 77%. This is because we keep our eyes fresh every weekend on the current trends, constantly review fundamentals on every stock we consider, and look for proper patterns to enter with reasonable risk and good upside.
NTES- Although Netease is in the $280 area, we focus on % upside potential not price per share. PE 20, Growth 40, 5 week corrective pullback in place. Chinese internet and online gaming company.
ESNT- Always on our list it seems, 8 week base pattern, PE 15, Growth 40%, Mortgage Insurance provider
BEAT- On our list several weeks ago then it broke out to the upside. Now in another 4 week upside base pattern. They provider remote ambulatory management and cardiac patient monitoring systems. Growth 53, PE 32
ATHM- 6 week base pattern, tested the 10 week line and bounced, PE 18. Strong Chinese automobile internet based name.
CRTO- Ad Technology firms are in short supply as they are getting bought out. CRTO is in a 4 week base pattern near highs, often on our list. PE 24, french based firm.
GMS- On the list last week, Construction products, 3 weeks ascending base
HUBS- Inbound marketing and sales company, see the trend? Breaking to highs, cash flow positive, working on moving towards profitability, under strong institutional accumulation.
RGEN- Breaking out of 25 week base to highs, in the Biotech sector we discussed above
ENTG- Semiconductor sector, also hitting highs
MMSI- Disposable device manufacturer for Cardiology, Radiology, and Endoscopy
CENTA- Central Garden and Pet, PE 25, 5 week base, strong growth, sector leader
LITE- Fiber Optic stocks correcting hard of late, Reversal upwards off 6 week correction last week
TRVG- Post IPO base continue for German based Hotel Booking operator spun out of Expedia
KRNT- Digital Printing for Textile industry, 10 week correction ending?
Are you ready to try something different? Would you like less risk and higher returns on a consistent basis with your trades? Market forecasts that keep you ahead of the curve at every turn? Read up and join us at StockReversalsPremium.com