12 Jun Weekly Forecast and Trade Ideas- Market Top?
Was that the Top? A look at SP 500, Small Caps, Biotech, and more
- SP 500 update with charts and notes
- Small caps taking over ?
- Update on Biotech (XBI)
- Gold pullback, what is next?
- 17 Trade Ideas
- Market Notes

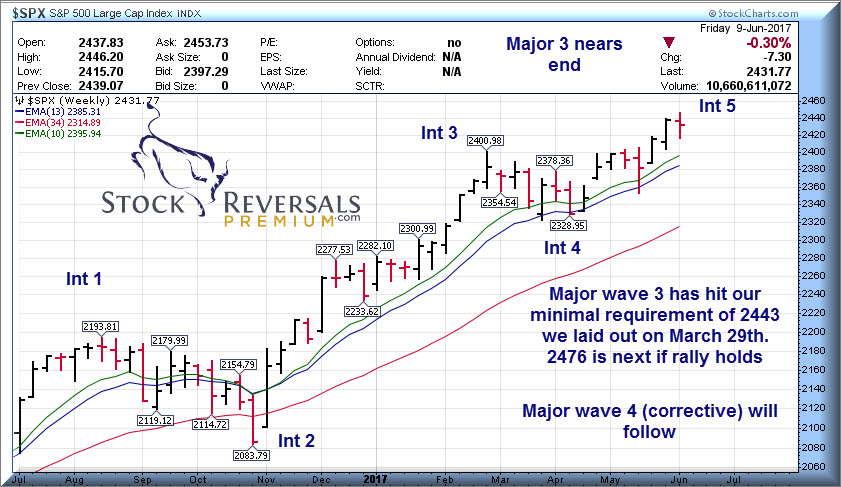
A head shaker of an ending to the trading week last week, or was it? We have been writing about and projecting a coming top of Major Wave 3 in the SP 500 with a 2443 low end target we put out in late March. We have never moved even one point off that target the entire time during this 5th wave of Major Wave 3. The reason is that is a low-end target, it’s the absolute minimum we expected to see for a Major 3 high.
This past week we hit 2446, just 3 points past our 2443 target and that was on Friday. What happened was a massive reversal which makes sense. You get a human behavioral reaction off those pivot points and they are often violent and come without much warning. We saw the SP 500 hit 2415 but then bounce up to close in the 2431 area.
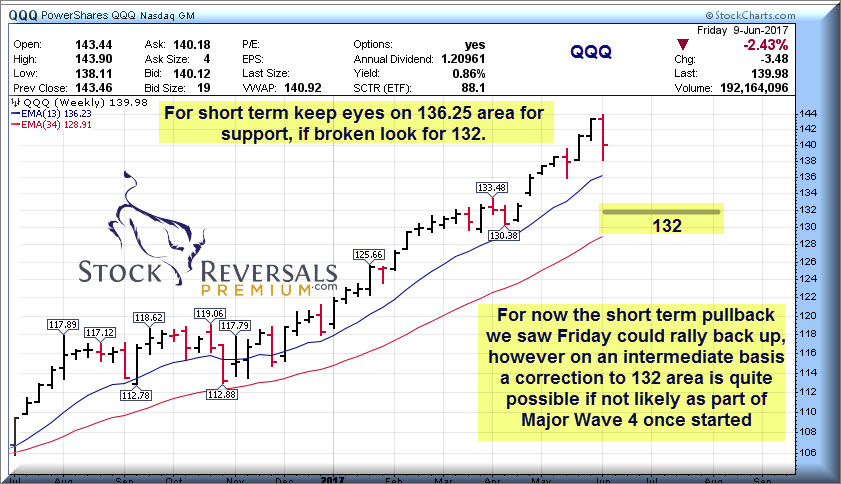
We also saw the Tech Stocks (QQQ ETF) really get hammered, reversing so hard intra-day that they filled in a 38% Fibonacci pivot right near the days lows before a slight bounce, and that was violent action with volume.
Now everybody wants to know… was that the top? The answer is yes and no…
Take a moment to Opt In for our Free Stock research and Market Forecasts here: Name and E-mail only, and we do not share your information with any other entity.
[Recent winners given to SR Members in reports: STRP up 500% in 21 months from Research Report. TRVG up 70% in 8 weeks from Post IPO Base report, SHOP up 230% from 2016 long term stock report and more!]
Why? Yes, 2446 qualifies for a Behavioral pivot high and possible top for Major Wave 3. However since it’s the very low end of our projections we have not yet confirmed that was the official top and 2476 is actually a perfect pivot high. Its also possible we end up with an extended 5th wave up from 2323 4th wave lows, so right now we do not have a definite answer.
What we can do is review the charts both daily and weekly and see the pullback though sharp, is still within the uptrends. As much as we love our Elliott Wave theory work, we like to keep ourselves in check with other indicators as well.
Weekly SP 500 chart below shows 2446 high,3 points over our low end 2443 projection:
Daily SP 500 chart shows a sharp pullback on Friday below. A large intra-day swing and yet still above the 13 day EMA which is at 2422. The 13 day EMA is a line we often use at SRP for our forecasts, as well as 34 day EMA.
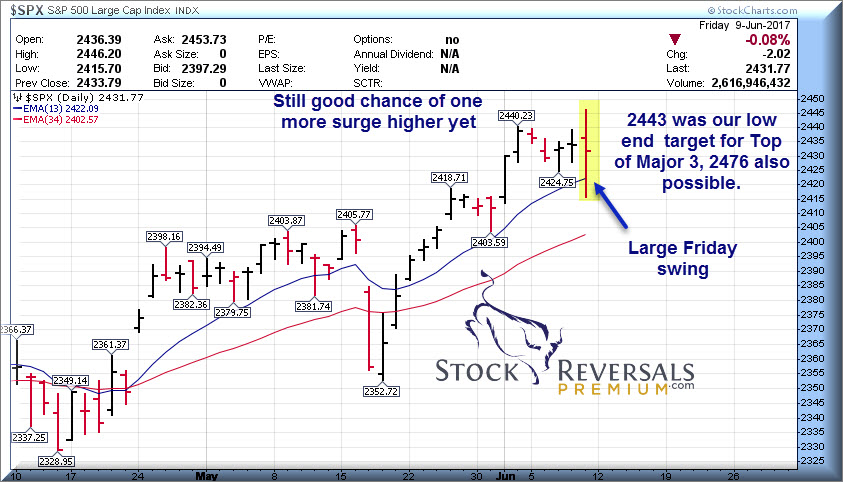
So we do not have a confirmed Wave 3 top just yet but we will be keeping our SRP Members up to speed during the week based on developments.
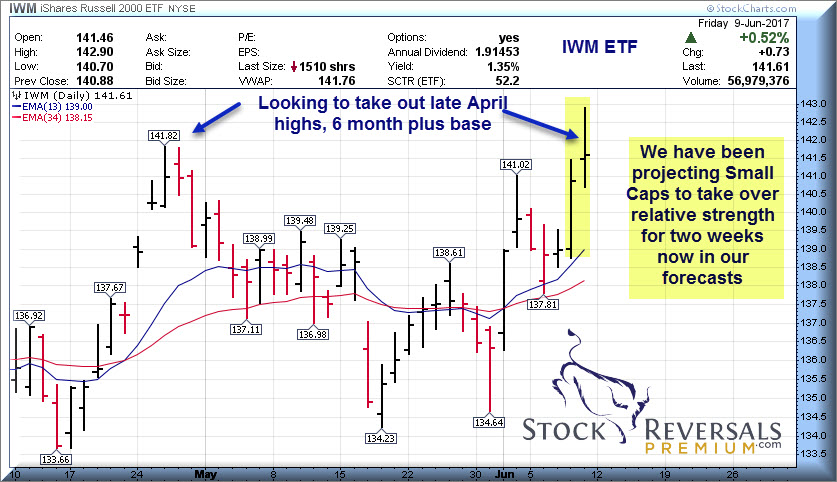
The Small Caps (IWM ETF) we have been discussing for two weeks as possibly out-performers relative to the Large Caps going forward after a more than 6 month consolidation. This is something to watch closely and we can see with the IWM ETF chart below the relative move of late:
We can see a short term double top in the IWM but what we may get is a pullback and then surge higher, depending on the status of Major 3 near term. Its a pretty deep cup base pattern..
The NASDAQ 100 index (QQQ ETF) update- Weekly view still OK
A sharp drop on Friday after the NASDAQ hit highs as well as the SP 500 Index. This looks a bit forced and algo based as stops were run with power. Note the huge volume bar at the bottom of the chart. That said, even with the short term damage the general uptrend lines are not yet broken. We could see the QQQ in the 132 area at some point ahead as Part of a Major wave 4 so bear that in mind as well.
Biotech Update: Double top and attempted breakout fails for now
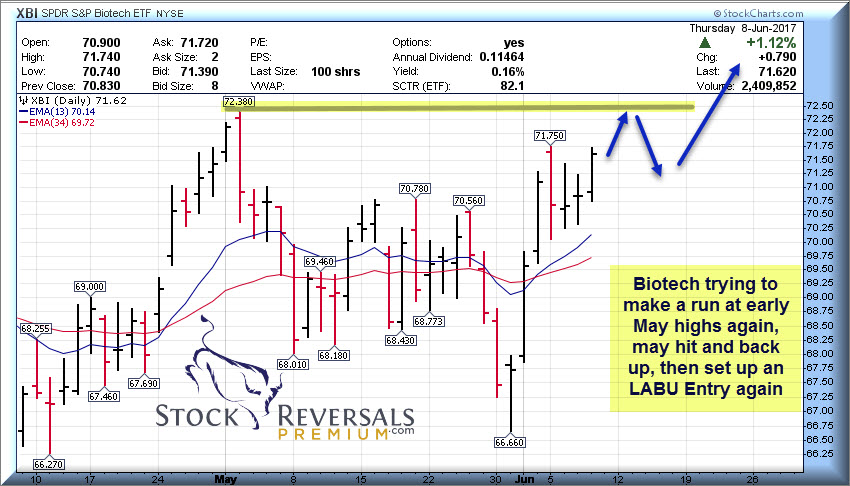
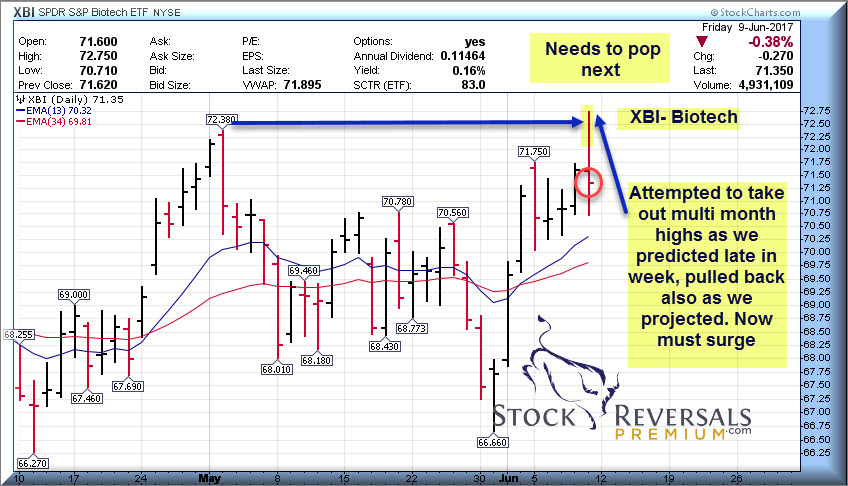
We had updated our SRP Members and SR members both on Friday to look for a surge up in the XBI to test Spring highs, and we said look for a pullback right after that surge which may set up an LABU ETF entry. This is exactly what transpired, below we show our Friday morning chart and then the end of day chart.
Friday pre -market prediction of pattern, it played out that day…
Below you can see the intra-day spike high at 72.75 for XBI then the sharp pullback to 70.71 before the bounce
Gold Update: Normal pullback from double top
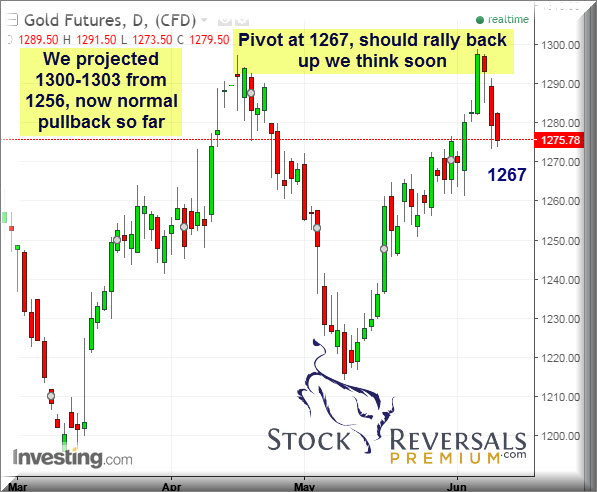
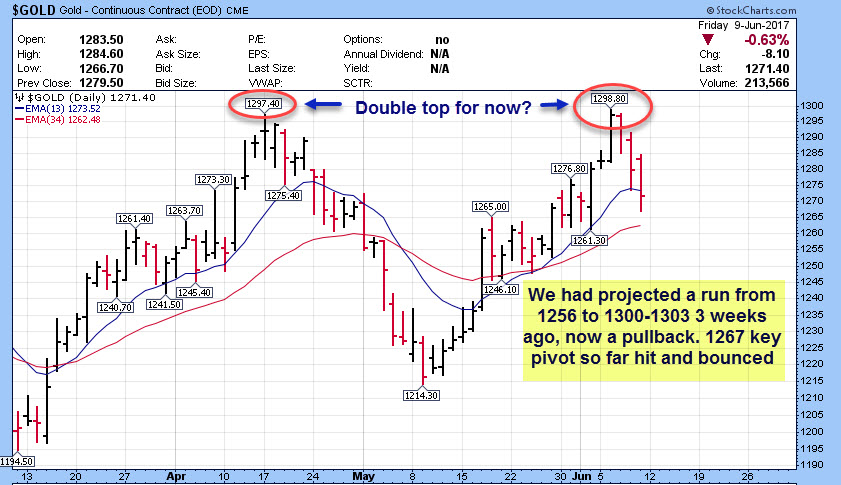
We had projected Gold to rally to 1300-1303 from a 1256 area a few weeks back for our SRP members and in weekly reports. We hit 1299 on the futures and since then have dropped 32 points to a 1267 pivot low. Late in the week we told SRP Members to watch 1267 as a key support pivot and that held to the tee on Friday. We will see if Gold can make another run to 1300 area.
Below is our Friday morning Gold chart to SRP members *(Gold did hit 1267 and closed at 1271)
For now a double top remains in place and again we think 1267 is Key Support
Bottom Line? No clear confirmed top yet, we hit 2446 which is close enough to our projected 2443 minimal high for Major 3. Gold hit a double top which we projected and pulled back to the 1267 pivot. The QQQ index actually hit a 38% Fibonacci pivot on Friday and bounced a bit. The XBI ETF hit a high and pulled back as we thought. Let’s see how the action unfold this week with the Fed meeting and also a big E Gaming conference starting Tuesday.
Market Notes:
The Top 10 IBD 50 stocks are sporting extended Price to Earnings Ratios. In order of the top 10 stocks the PE ratios are 72, 31, 18, 76, 42, 49, 50, 30, 45, and 21. Those are not cheap by historical measures and important to note when you are selecting trades.
Money seemed to be rotating into Banks late in the week after a very long consolidation and corrective period.
Look for stocks with relative strength during any pullback for candidates
Expect new leadership may emerge.
Swing Trade Candidates: 17 names
Each week we put out a list of 10-18 stocks that we like and plan to do more drilling down on. Last week quite a few of the names were doing very well up until the Friday afternoon slam. BABA was on our list of 11 last week and was the clear winner.
HOME- Recent IPO of a home retailer keeping relative strength
GDOT- In the Cashless Society sector as we say, hitting highs. Been on list multiple times
YY- Entry would be great here on a bit more pullback, Chinese broadcast emerging leader, on list often
GRUB- Now on a 7 week base for this Food Delivery play, on list often of late
CRUS- 1o week tight base pattern for circuit maker, PE 15
TSM- 5 week base pattern for chip maker, PE 16
MTSI- If $53 area holds on pullback its attractive
SQ- Cash less society, on the list many weeks ago before huge move up. Pullback more attractive.
Z- Zillow had surged after being on our list many weeks ago, now a pullback could make more attractive
TTMI
APO- Private Equity firm with strong growth reasonble PE and 5% Dividend
ATH- Financial post IPO base and pullback now makes more attractive. PE around 12
WD- 7 week base pattern, also in financial sector. Surged off a Sunday list many weeks back, provide financing for multi-family and other properties. Reasonable PE ratio too
LPL- Flat Panel Display LCD’s for various markets, PE ratio 8
MGM- 7 week base for gambling concern
GLW- 10 week test, nice pullback for entry.
SRP Swing Trade and Forecast Alert Service: Read up and join today – See what our customers are saying, our full track record, sample alerts and reports and more.
“I really like what you’re doing (and it’s not just because you’re on a hot streak right now). I feel like you have the whole package – solid fundamental and technical expertise – combined with a very realistic grip on trading psychology.” A.W. – 3/28/17- SRP Member
Check out our swing trade service where we provide research, reports, entry and exit alerts via SMS and Email, plus morning reports, market forecasts daily and more! www.stockreversalspremium.com


