


05 Mar Weekly Forecast and Opportunities- Major 3 High Update
Just an Interim Top? SP 500 hits key projection area near 2406
At The Market Analysts Group, we focus on a combination of Human Behavioral patterns as well as Fundamentals in both our Forecasting and Swing Trade planning. Elliott Wave Theory can be very complex for many to grasp, yet if you strive to keep it simple its an extremely valuable tool for understanding where you are in the current rally or in a corrective decline.
Looking backwards and forward, the stage of the rally:
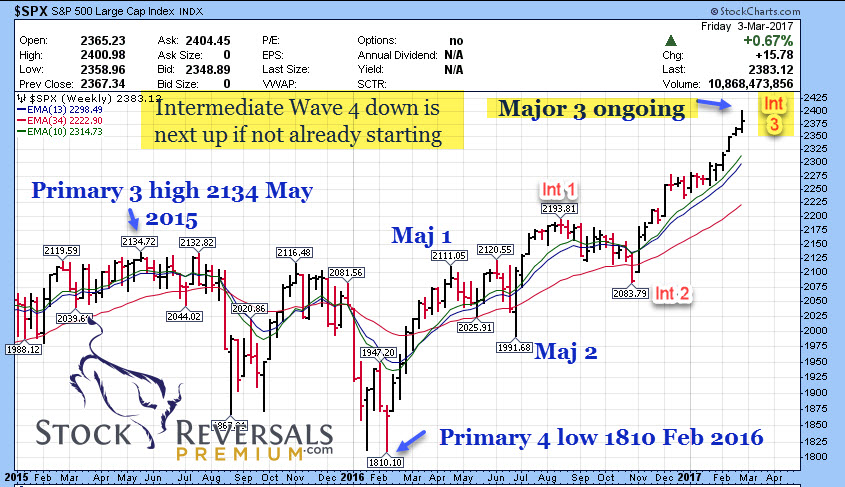
Back in November around the US Election time we had a bottom of 2083 in the SP 500 index, right at the 200 day moving average, but also a Fibonacci retracement level of a prior bullish wave pattern up. From that level, once we broke over 2101, we projected upwards of a 300 point rally for SRP Members and for a high end target of 2406 as possible. We assumed this would be a strong “3rd of a 3rd” wave pattern and it has been.
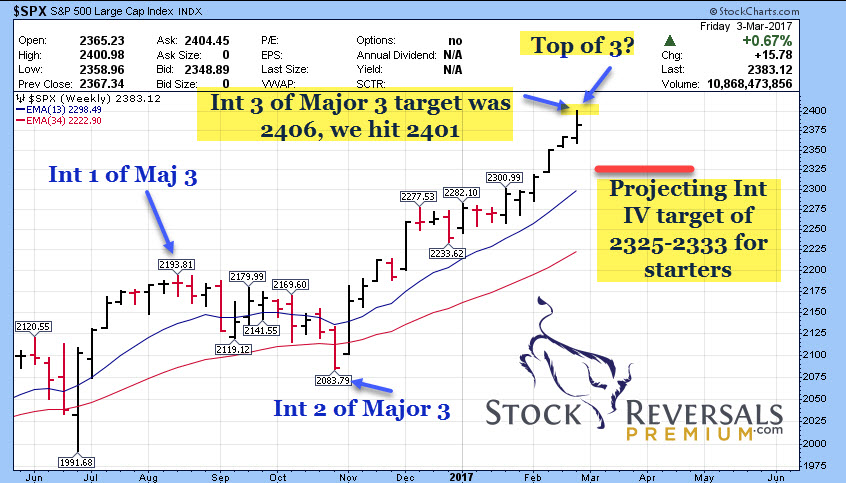
This past week we hit 2401, close enough for government work to call a possible Intermediate Wave 3 high with a corrective Wave 4 underway. We are not calling the top of the Bull Market here, just an interim top as likely. This weekend we provide some details on our Wave count and we will monitor and adjust from here. Therefore the Swing Trading environment is still healthy, but expecting some bumps ahead near term.
Here is our Long Term SP 500 Wave chart: Major Wave 3 ongoing, we are or have been in Intermediate Wave 3 up from 2083.
Here are some additional SP 500 charts
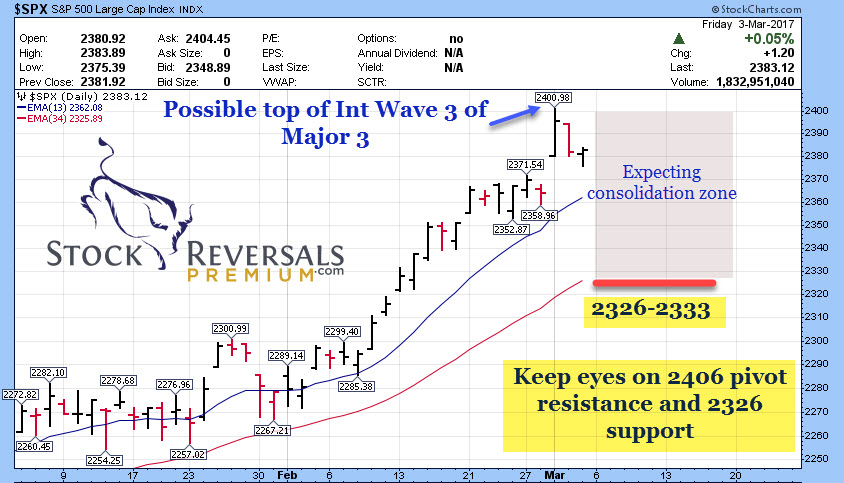
Support at 2326-2333 expected on a decline: If we somehow rally past 2406 then we have an “Extension” Wave, and we will update if so, but not expecting it.
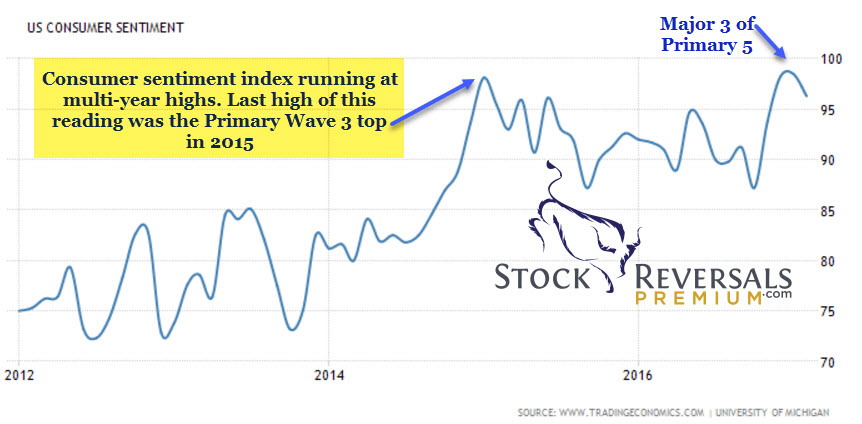
Of note, the Consumer Sentiment Surveys from the University of Michigan have reached the same levels from 2015 when the Primary Wave 3 rally topped out at 2134, just another indicator of the bullishness of the current wave up in the markets.
Investment Advisory survey: Hitting highs in Bullishness with 63.5% Bulls and only 16.5% Bears
Bottom line is evidence mounts up for an Interim top near 2400 and a decline of about 76 points is expected as a minimum to work off some of the sentiment highs of the 3rd of a 3rd wave pattern up from 2083. The top of the Bull Cycle is not yet done, but Intermediate Wave 4 should have the markets pullback and then Intermediate Wave 5 to new all time highs will commence.
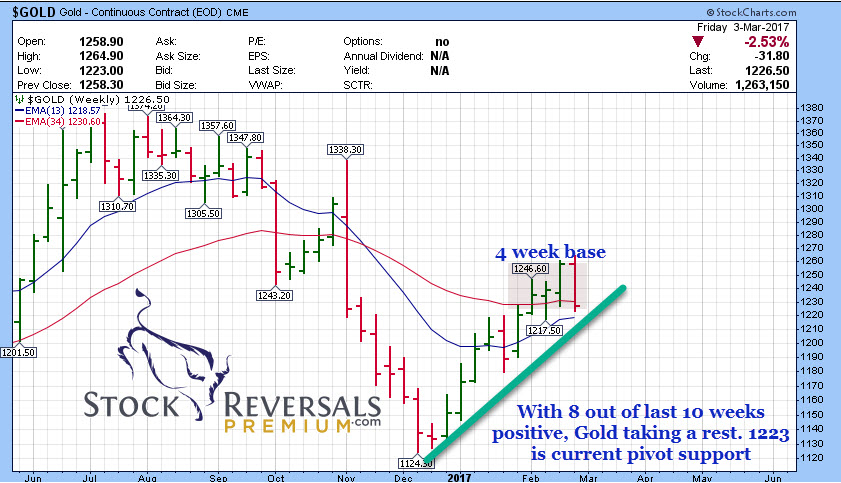
Gold Update: Strong US Dollar hits Gold, 1220/1223 key support
Gold has pulled back from 1265 area highs after a strong run up from 1124 pivot lows. Once over 1250 we felt Gold would continue to the 1329 area ahead, and that is still valid intermediately but we must assess the current patterns. We would like to see this 1223 area hold, which for now it did on Friday:
The general weekly uptrend remains intact per the chart below: After 8 of 10 weeks up, Gold is taking a breather.
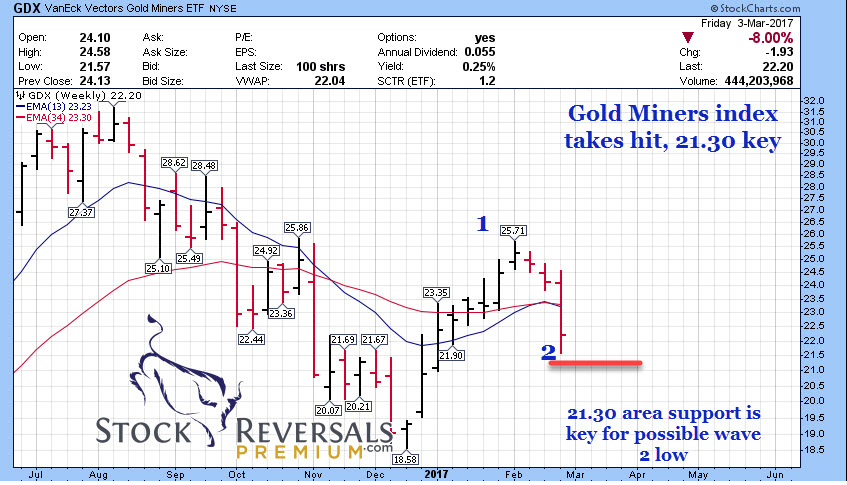
GDX ETF Update:
The Gold miners ETF has pulled back sharply and usually will lead the metal in movement. We would keep an eye on 21.30 as key support, and a reversal trade is setting up there if it holds (NUGT).
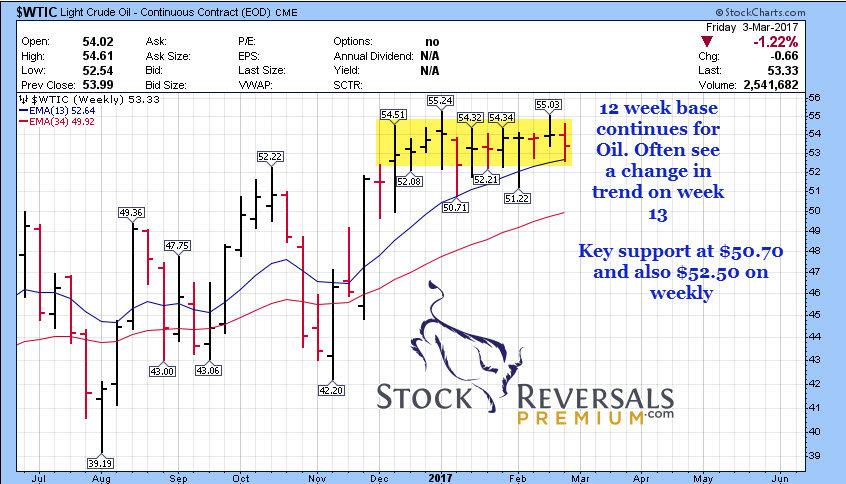
Oil Update: 12 week base count continues
50.70 key support on the daily and 52 area on the weekly for Oil to continue this consolidation. We often see trend changes at 13 weeks, which is this week ahead.
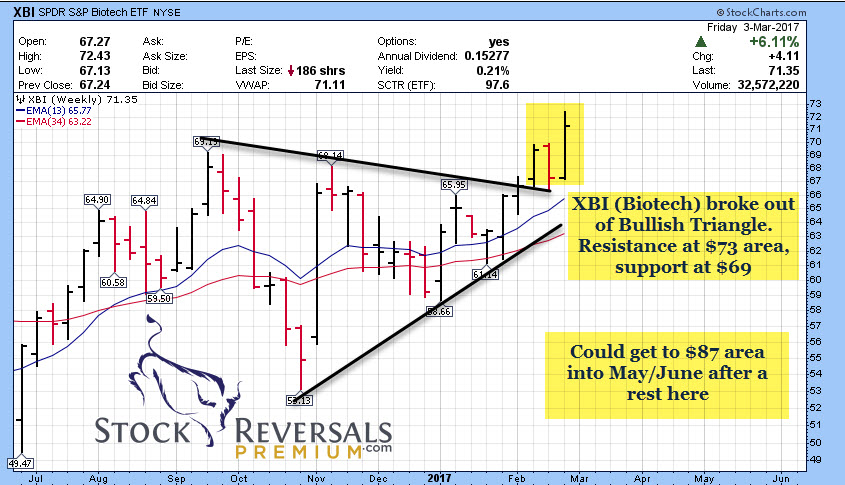
Biotech Update: XBI in Bull Mode
XBI ETF we use to review the status of the Biotech market. We have been bullish on this for awhile due to the former series of higher lows, ABC, and Triangle Patterns that were emerging. We broke out of this triangle pattern, and ran into some resistance at 70-73 which we have been writing about last week or so as likely. Expecting support short term at the $69 area, which could be a nice entry in to LABU ETF.
Other Market Notes:
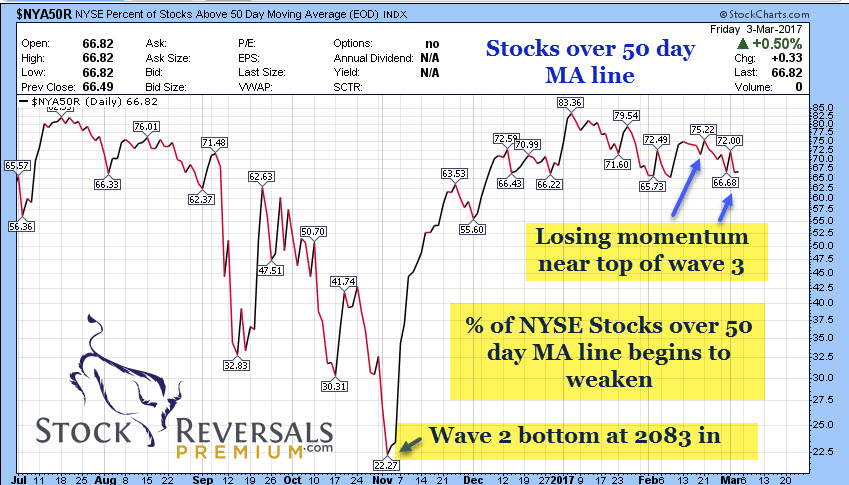
The percentage of NYSE stocks above their 50 day moving average has stalled out per the chart below. Often concomittant with a consolidation or shorter term top
Are you ready to try something different? Would you like less risk and higher returns on a consistent basis with your trades? Market forecasts that keep you ahead of the curve at every turn? Read up and join us at StockReversalsPremium.com
Swing Trade Ideas: Fundamentals are always key, not just the chart pattern
We like to keep updated Watch Lists for our SRP members which we often work off for new Swing Trade alerts. This requires us to drill down into the fundamentals much further, but we start with solid fundamentals and a nice chart pattern, and then go to work from there.
YTD we have closed out 24 of 30 Swing Trades for gains and in 2016 we had a 77% success rate. How?
Using the required discipline of both Technical’s and Fundamentals allows us to keep a very strong track record of 3 to 1 winners over losers and also to keep the losses within 3-7% typically and the gains 6-20%. We never skip on the fundamentals, with no exceptions. The reason is in the event a short term chart pattern does not work out, in most cases if we did not stop out or a member was busy and missed a sell signal, they are not likely sunk in most cases. We also take into account current market conditions based on our forecast models as well as stronger or weaker sector analysis.
Basic Methods of Swing Trade Selection:
1- Identify a strong chart pattern and or sector- Multiple human behavioral based patterns we assess and then add in other indicators to confirm. We prefer base patterns in general or prior corrective patterns completed.
2. Check the basic fundamentals or each candidate- Basic analysis on PE ratios, Sector, Fundamentals
3. Put together an initial watch list of 12-18 stocks
4. Drill down on each stock to review fundamentals in more detail. This includes management, product lines, share structure, catalysts, valuations, PE ratios, conference call transcripts, SEC filings, and more.
5. Sentiment– We love it when the crowd has given up on a stock or sector and its had a base pattern of completed correction.
6. If enough criteria are met and the pattern is setting up, we can then look at pulling the trigger on a Swing Alert, market conditions are also important.
This weeks Watch List: 12 ideas
VUZI- Virtual reality and or Augmented reality gear maker. Recently teamed up with Toshiba. One of our faves for 2017-18
TRVG- Post IPO base pattern looks bullish for this German online Hotel booking operator
TLND- Software sector is strong, long term POST IPO base for this Database provider
CELG- May finally break out of this 17 week base pattern. PE 21, Growth rate 36% for this Biotech King
MOMO- One of SRP’s longstanding growth stock favorites. Earnings come out Tuesday, could break out
TEDU- Chinese education provider
SUPN- 11 week base pattern for this Specialty Pharmaceutical firm. Flat base pattern , 86% recent YOY growth
AEIS- 5 week base pattern for this Power conversion provider
GRFS- New highs
ZAYO- Coming out of base pattern corrective phase, High Bandwidth infrastucture provider
BABA- 6 week base pattern continues with breakout possible market willing
ADXS- 8 Week Base pattern could move following quarterly report, higher risk