02 May Bear Market Cycles and 2022
Markets have been under extreme downside pressure and very high volatility of late for sure. It helps to have some historical references to try to determine where we may be in this Bear Cycle. The average Bear Market is 289 days or about 10 months. Depending on how you count this one, I can make a case that it started with Biotech and MicroCap stocks in February 2021.
The Generals (Large cap tech etc) have been hit in the last few months very hard after holding up during most of 2021. Usually the market does not bottom until the Generals fall.
You can buy Google for a PE ratio of 20 now, hasn’t been this cheap in years.
Amazon has crashed along with Facebook, Netflix, and the list goes on and on…
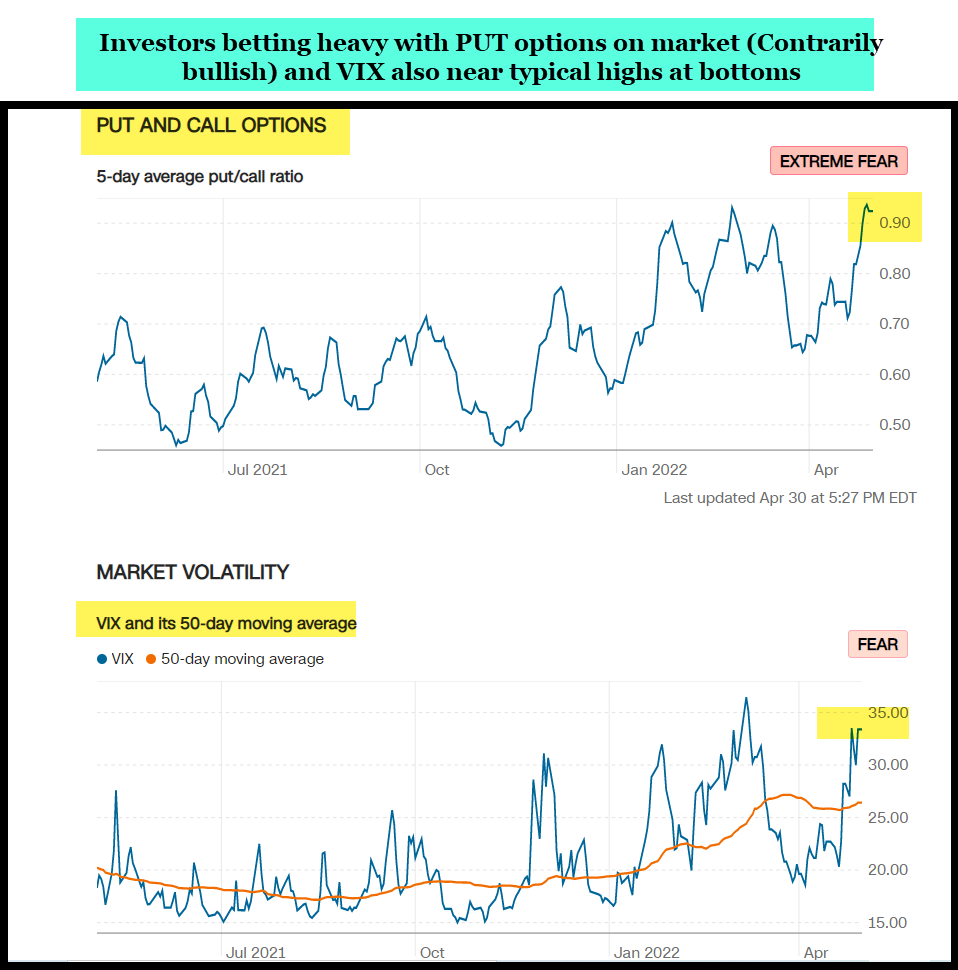
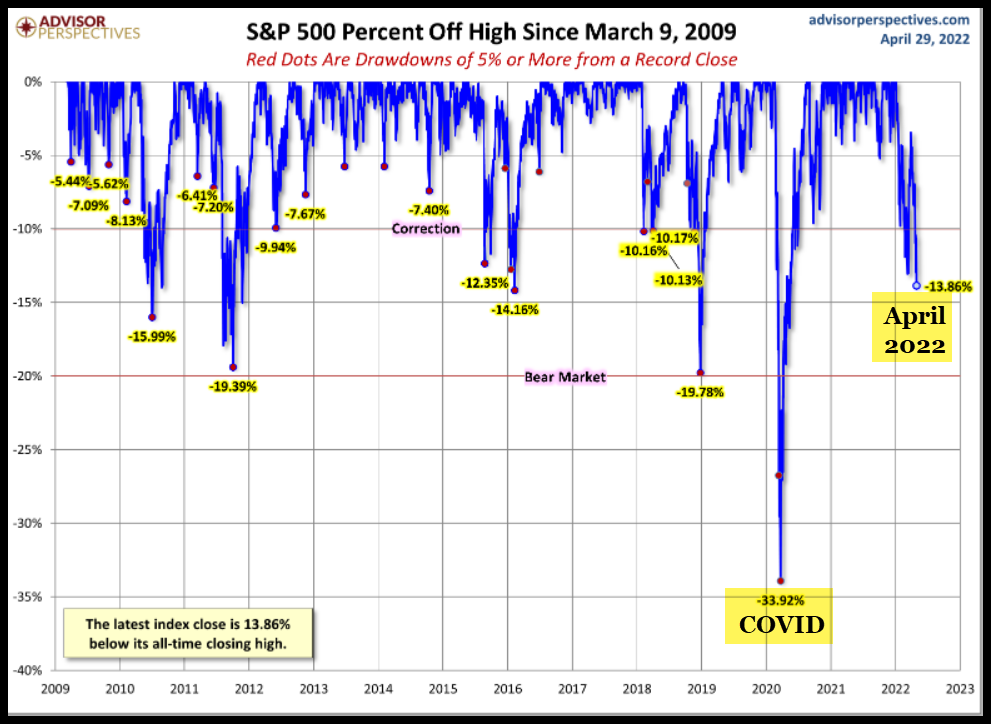
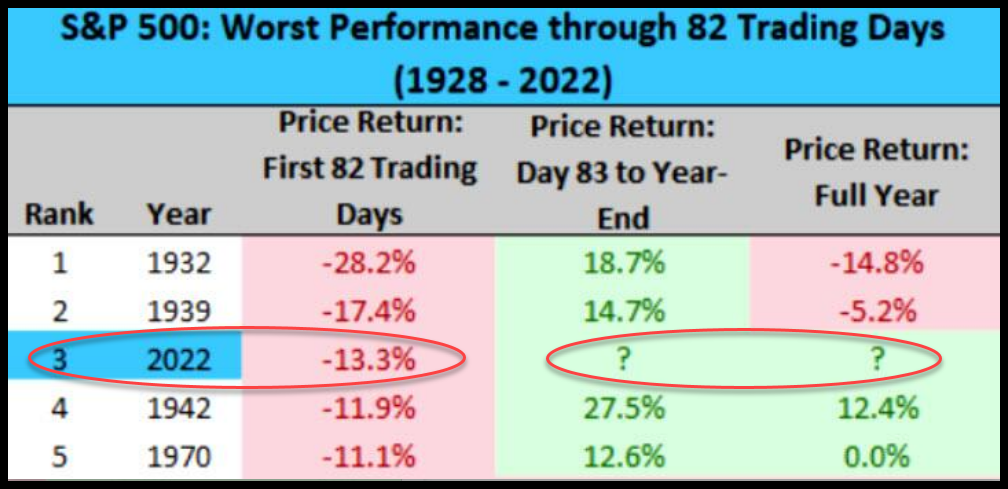
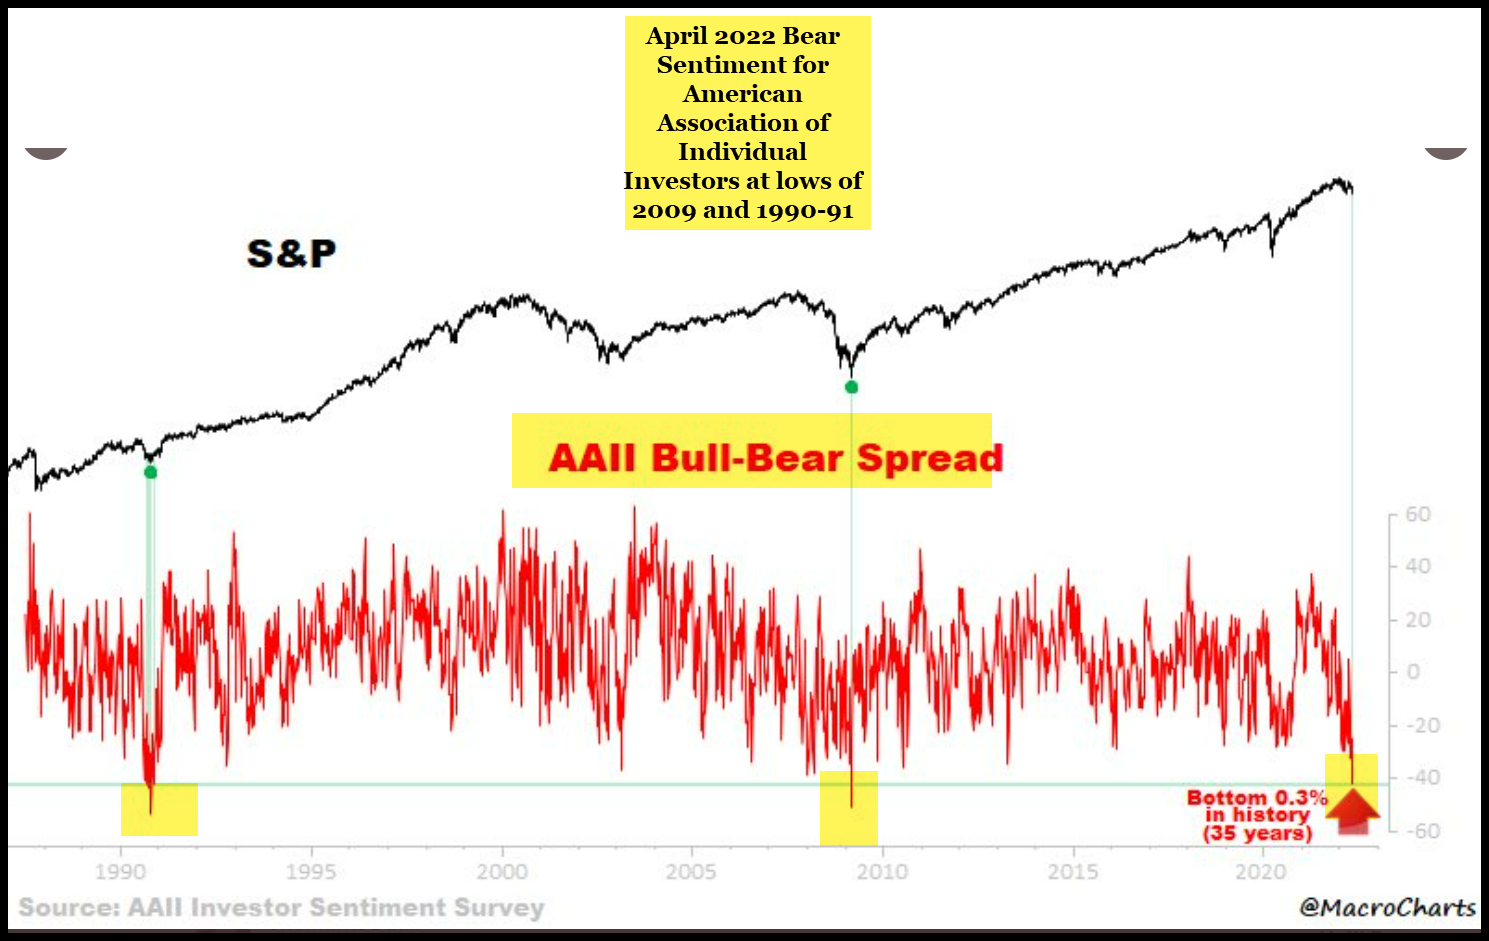
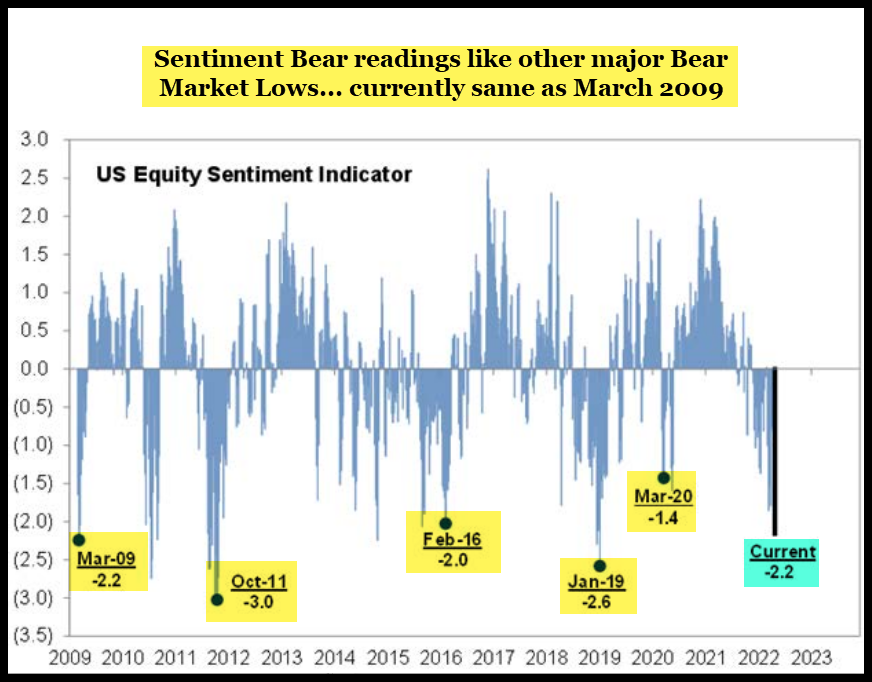
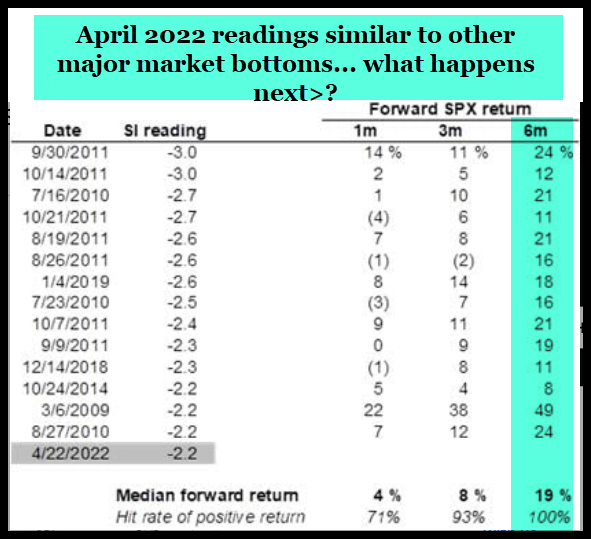
Below I present a series of charts that are somewhat self explanatory. In all cases they seem to be lining up for another major market bottom here in April/May.
Risks of further decline are continuing higher Oil and Energy prices, Inflation getting more out of control, and of course the conflict escalating overseas.
With that said, I’m seeing some amazing values in the stock market for long term investors now. With about 5-7% downside risk in the SP 500 to 3800-4000 possible, but upside returns likely much higher in the intermediate period… it may be time to start getting a bit more aggressive.
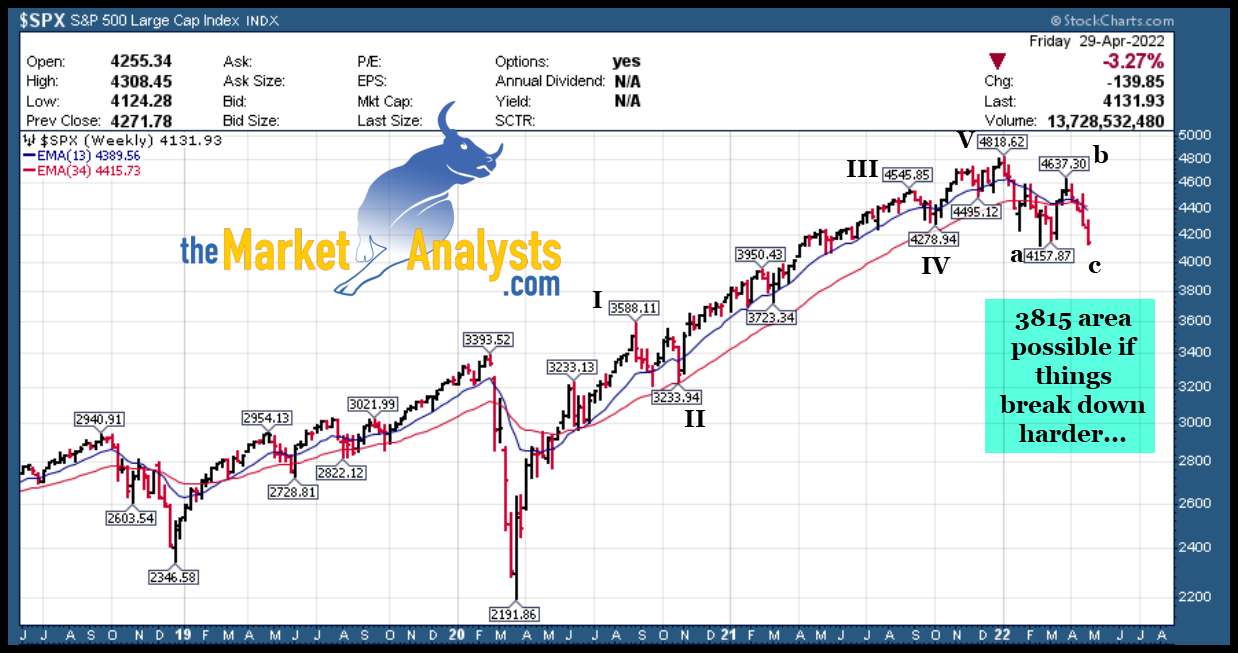
Multiple charts tell the story of a building case for a market bottom 2022:
If 4150 holds we bottom out in C wave… if not, 3815 area possible…