16 Apr ELLIOTT WAVE FORECASTS AND FREE STOCK TRADING IDEAS WEEKLY REPORT


Stockreversals.com (Opt in for Free reports) Stockreversalspremium.com Swing Trades, Forecasts and More TippingPointStocks.com Growth Stocks with 100% + upside
Weekly Elliott Wave Forecasts and Free Stock Trade Ideas Report for April 16th
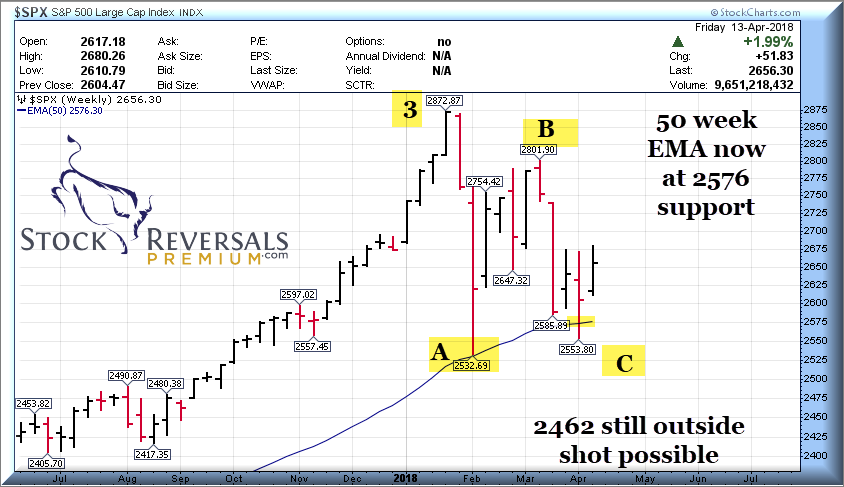
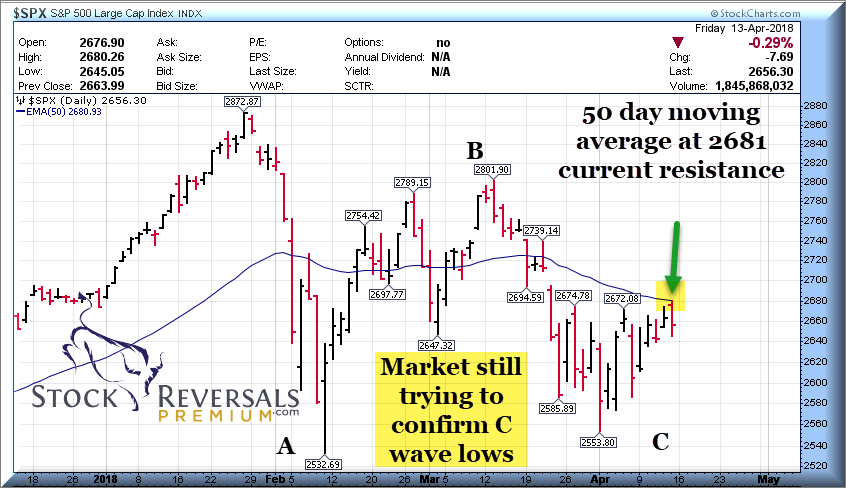
The SP 500 has formed an nice “rounding bottom” formation and is trying to confirm the “C Wave” of the ABC correction pattern from the 2872 highs is completed. So far the C wave low is 2553, about 20 points above the A wave lows, this would be somewhat rare. We are still keeping an eye on the 2462 and 2532 areas for a lower low for C. With that said, a break over the 50 day moving average line would certainly help confirm the C wave lows are in and we are in a new uptrend towards all time highs.
Throwing a possible wrench into the near term action is the Syrian Air Strikes on Friday night, but we we writing this on Saturday and we will have to see how the markets react. For now, the 2675/2680 area is key to take out on a closing basis.
We have some charts on the SP 500 daily, weekly, and also the IWM ETF weekly and Gold:
We also note that Bulls in the Investment Advisor surveys are down to just 42% vs 68% at the 2872 highs of Wave 3. Individual Investor surveys coming into this past week were also extremely bearish on a historical basis, along with the CNN Fear and Greed index chart which we shared last Sunday. This all puts arrows in the Bulls quiver for now, lets see how the market acts this coming week with Retrograde over on the 15th as well.
SP 500 Weekly: ABC pattern obvious, 50 week EMA Line support at 2576.
SP 500 Daily: ABC pattern, 50 day EMA line resistance at 2680
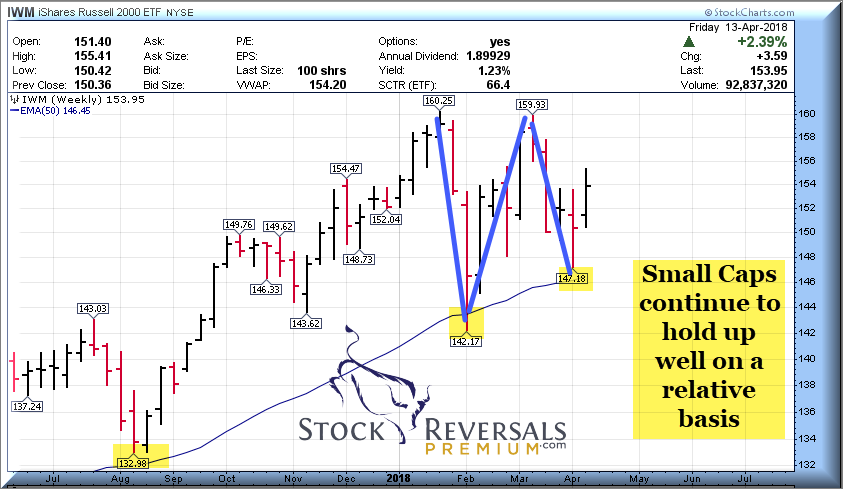
IWM ETF: Weekly chart shows relative strength and support lines for Small Caps
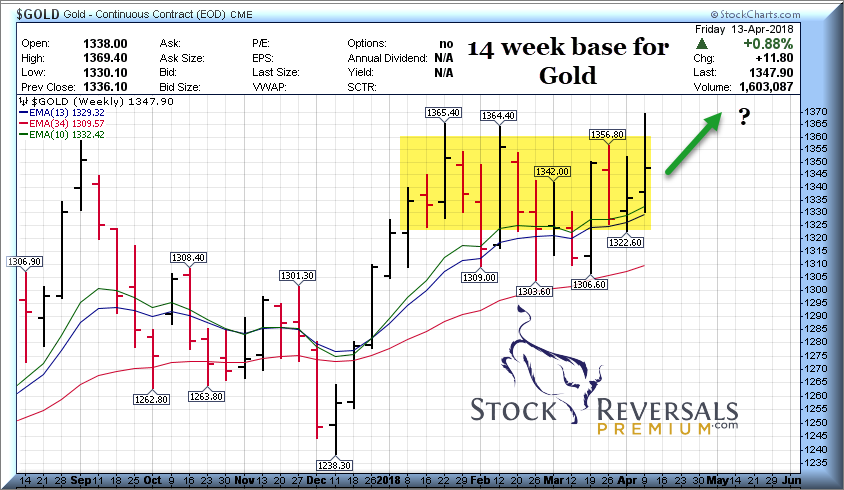
GOLD: 14 week base
Each week we try to list out 10-15 or so Free Stock Trade ideas with notes. These are great for a watch list to possibly act on a few and or take from for SRP Alerts depending.
SEDG- Solaredge Tech has been on the list often. Forming a nice 5 week base here, maker of solar inverters
VNOM- 3 weeks tight base on a nice longer term cup and handle for this Permian Basis oil and gas partnership
FND- 4 week ascending base for Floor and Decor, near highs. On our list often, multi channel floor retailer
BZUN- 6 week base near highs for Chinese E Commerce end to end solutions provider
TEAM- Also often on the list in the past few months, 6 week base near highs for team management software firm
CASA- 5 week base near highs, on our list of late. Recent IPO, Voice, Video, Data software for Cable firms etc.
SKX- 13 week base near highs for Sketchers shoe maker
ETFC- 6 week base near highs for E Trade
PAGS- 3 week corrective pattern on an overall 6 week base. Pullback to 33 area attractive for Brazilian payments provider. Recent IPO
ZTS- 8 week base near highs for Animal Health Medicines and vaccine provider (Livestock and companion animals)
MU- Micron has been volatile, but in a 5 week corrective base pattern, holding 10 week EMA Line
PLNT- Planet Fitness in 8 week base near highs. We were bullish on this back at $19, now $38
AYX- 8 week corrective base for self service data analytics firm
HOME- 12 week base near highs for Home Decor store chain with 151 stores
FTSI- Recent IPO in 11 week base, pullback of late. Hydraulic fracturing services for Oil and Gas industry
INVA- 9 week base for small molecule respiratory disease drug maker
ETSY- 7 week base near highs for Etsy… the online line e commerce service for handmade good makers
Swing Trading and Elliott Wave Forecasts service with real time buy and sell alerts, full informational posts on each position as alerted, morning pre market updates on the markets and all open positions, 24/5 access to our Chief Strategist, Tutorials and more!
Join today! 72% Success Rate since inception September 2013
Get 30% off a Monthly or Quarterly subscription using Discount Coupon Code: PSFFT5NWT1
sign up here (Click to Register)
“I really like what you’re doing (and it’s not just because you’re on a hot streak right now). I feel like you have the whole package – solid fundamental and technical expertise – combined with a very realistic grip on trading psychology.” A.W. – 3/28/17- SRP Member
“David, you are, without a doubt, one of the best if not the best Elliott Wave guys I am aware of” 8/30/17
Peter Brandt, CEO, Factor LLC (One of the worlds top Commodity Traders and Technical Analysts)