


08 Jan 2019: Boom or Bust?
If you are not yet an “Opted In” Member of StockReversals.com , sign up today to get our IPO, Swing Trade and Market Trend updates.
2019: Boom or Bust?
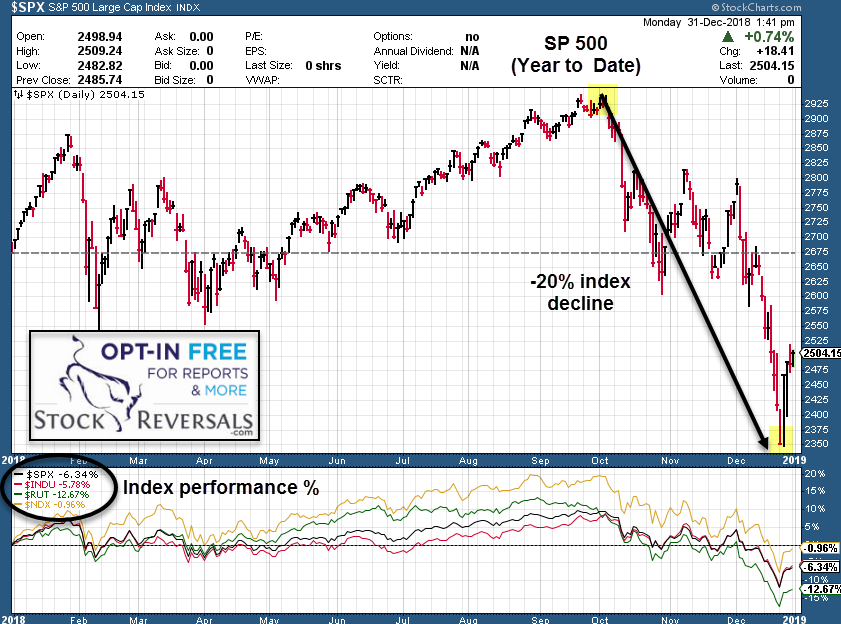
The year of 2018 has been a wild one with the SP 500 up nearly +10% through September and then by mid December down -12% for the year, ending the year down just under 7%, over a 20% swing in 3 months! The other major indices also having similar swings, especially the Russell 2000 index of small cap stocks!
Going into 2019, we define a Bear Market as when the preponderance of stocks are trading below their 50 day moving averages, and can last several weeks, months or 1-2 years. It’s all relative. Over the last 3-4 months the SP 500 has been in an overall Bear Market with rallies along the way.
The typical Bear Cycle if you will is about a 30% decline in the SP 500 and over 9-15 months from top to bottom on average.
So, have the markets bottomed or are they going to fall further in 2019?
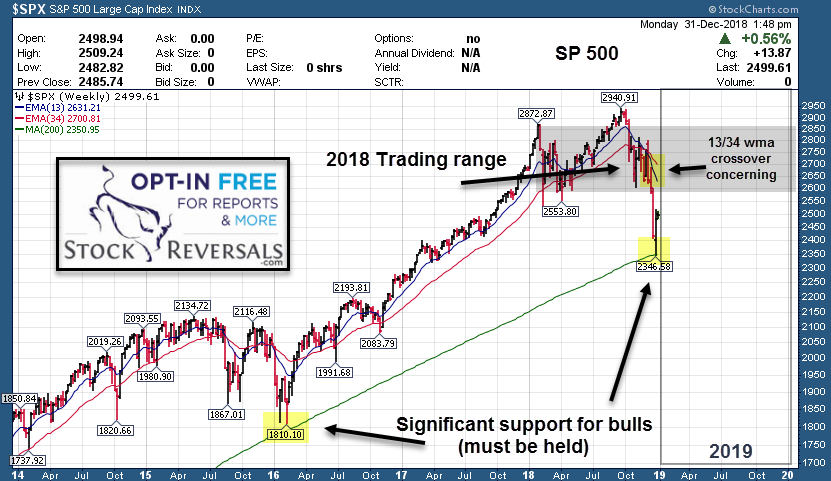
See our weekly SP 500 chart, showing major support holding the first touch of 200wma, but likely will be backtested again before long. Also, the 13/34 weekly ema crossed bearish and until that moves back positive again, pressure will remain to the downside.
We find it interesting however, the forward looking 10 year correlation of Crude Oil to SP 500.
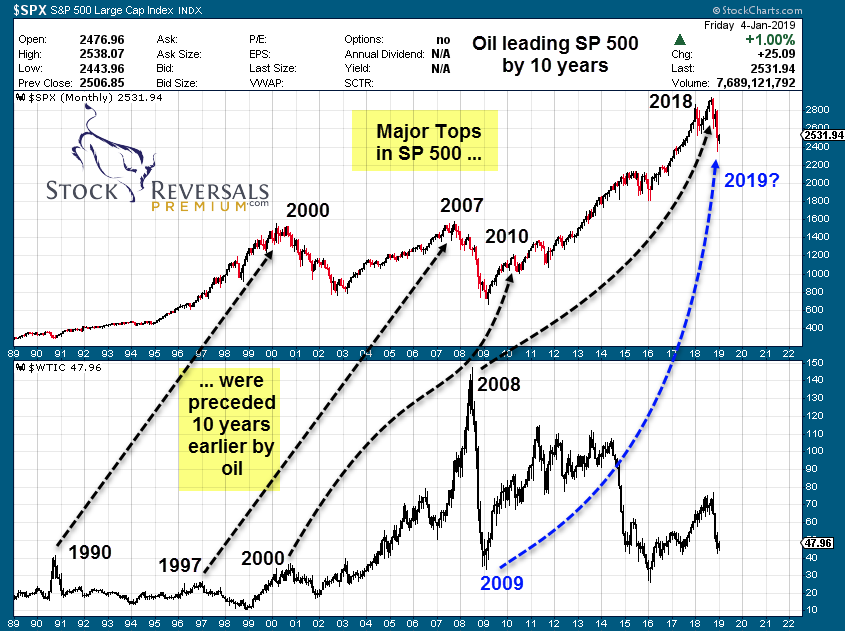
While not a perfect match, there’s enough of consistency to have a look. If you’ll notice, there were major tops in the SP 500 10 years after major oil tops, as well as some major bottoms (not indicated). 2009 was a major bottom, which implies 2019 could see a major corrective market bottom, which would make sense given the ABC decline we are expecting off the 2018 highs.
Have we already seen that major market low in late Dec 2018? Not likely.
- A rally up to 2640’s and even 2715’s area ahead is possible. This is where the Bulls may run out of gas in early 2019 though, so those zones must be respected and watched for reversals.
- Typical Bear Cycles has a larger A wave down, A-B-C to form the A at 2346 lows. Now an ABC up to form a B anywhere from 2640-2715 area we think.
- The risk then is of a reversal for the C wave of the Bear, and this is what we will be tracking.
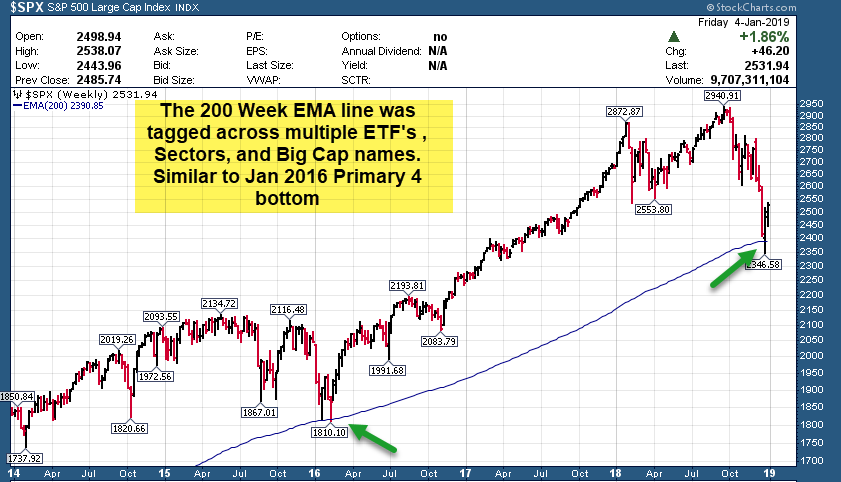
For now, the 200 week EMA Line has held the correction pattern off the 2940 SP 500 highs of 2018.
If you are interested in staying informed with our macro market charts around SP 500, biotech, swing trade ideas and more, then please opt in for our FREE weekend report here.
OR ….
If you are interested in a market beating swing trade alerts service to assist you with your trading, consider signing up for our Premium Service <– (Click Link to learn more) with a 70% success rate since September 2013 inception!
At our Stock Reversals Premium Swing Trade service we send an SMS text, E-mail, and SRP Members-only Blog Post with details on the company, entry and exit advice, stop loss parameters, plus SMS text and E-mail alerts to sell, morning reports every day covering all positions pre-market, ongoing strategy and trading advice, market forecast models updated daily, and 24/5 access to our Chief Strategist.
Read more on that service here SRP Premium and for a limited time, use Coupon Code: PSFFT5NWT1 for 30% off Monthly, Quarterly, or Annual Membership